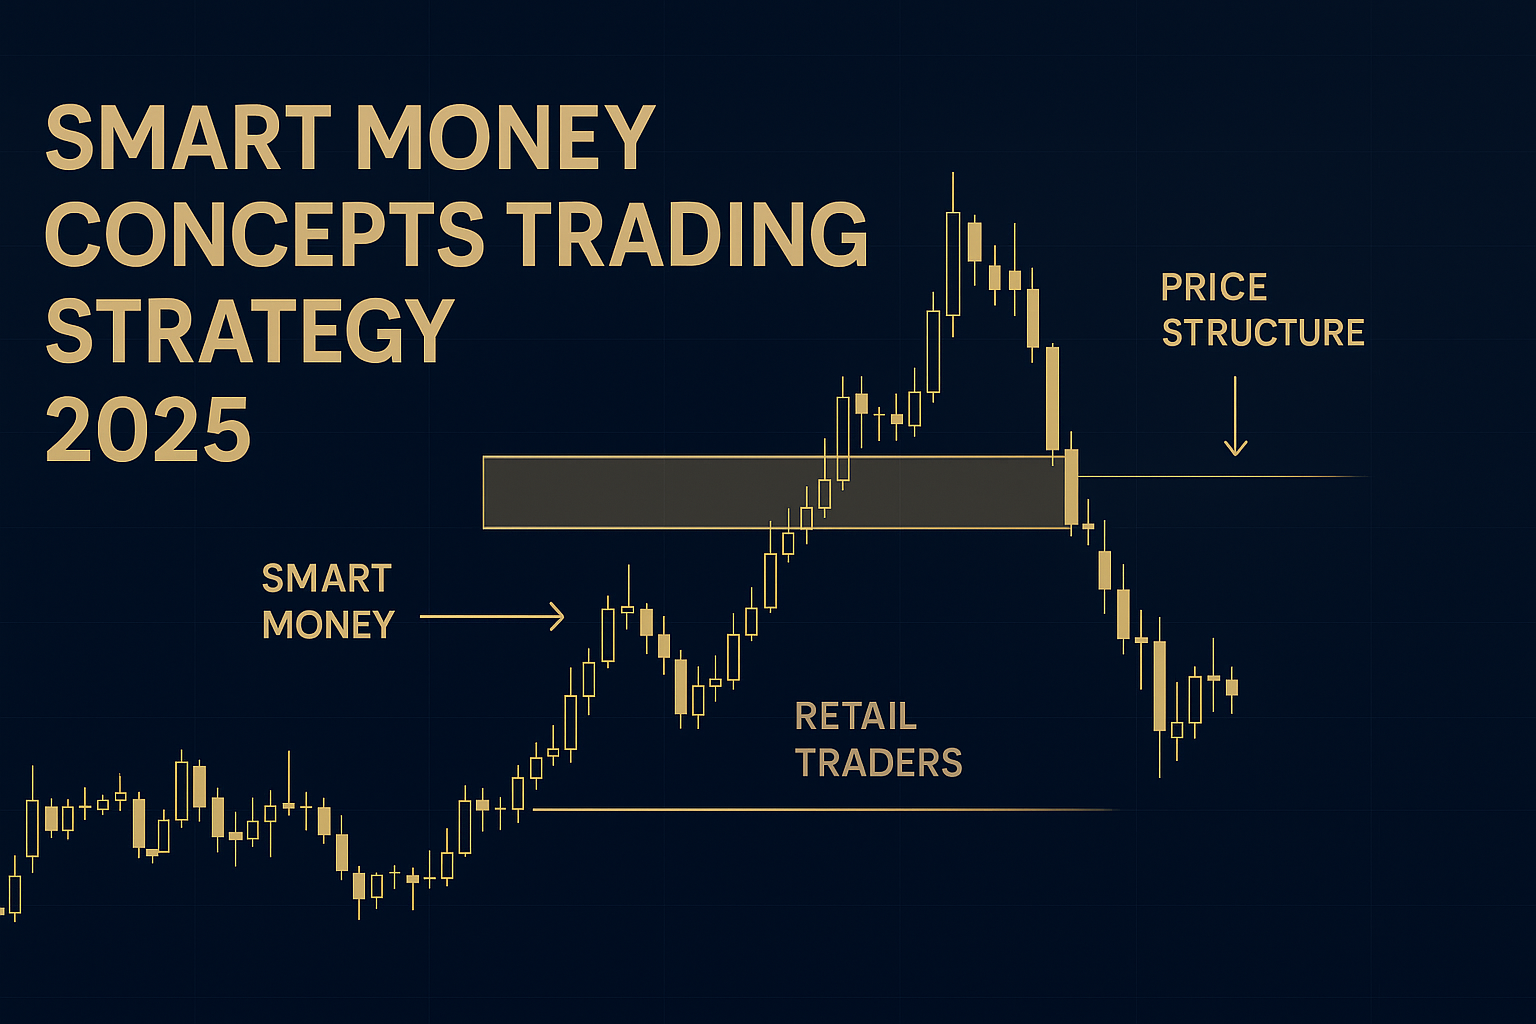
Smart Money Concepts (SMC) Trading Strategy: Complete Guide
Master institutional trading techniques and learn how to trade like the banks. Complete guide to order blocks, market structure, liquidity pools, and SMC strategy.
What is Smart Money Concepts (SMC)?
Smart Money Concepts (SMC) is a revolutionary trading methodology that reveals how institutional traders—banks, hedge funds, and market makers—manipulate price movements to accumulate positions before major market moves. Unlike traditional retail technical analysis, SMC focuses on understanding the footprints that "smart money" leaves in the market.
💡 The Core Principle of SMC:
Institutions need liquidity to fill their large orders. They manipulate price to trigger retail traders' stop losses, creating the liquidity pool needed for their entries. By identifying these manipulation patterns, you can trade alongside institutional money instead of against it.
SMC was popularized by Inner Circle Trader (ICT) and has become one of the most sought-after trading strategies in 2025. The strategy combines price action analysis with an understanding of market structure, liquidity, and order flow to identify high-probability trading opportunities.
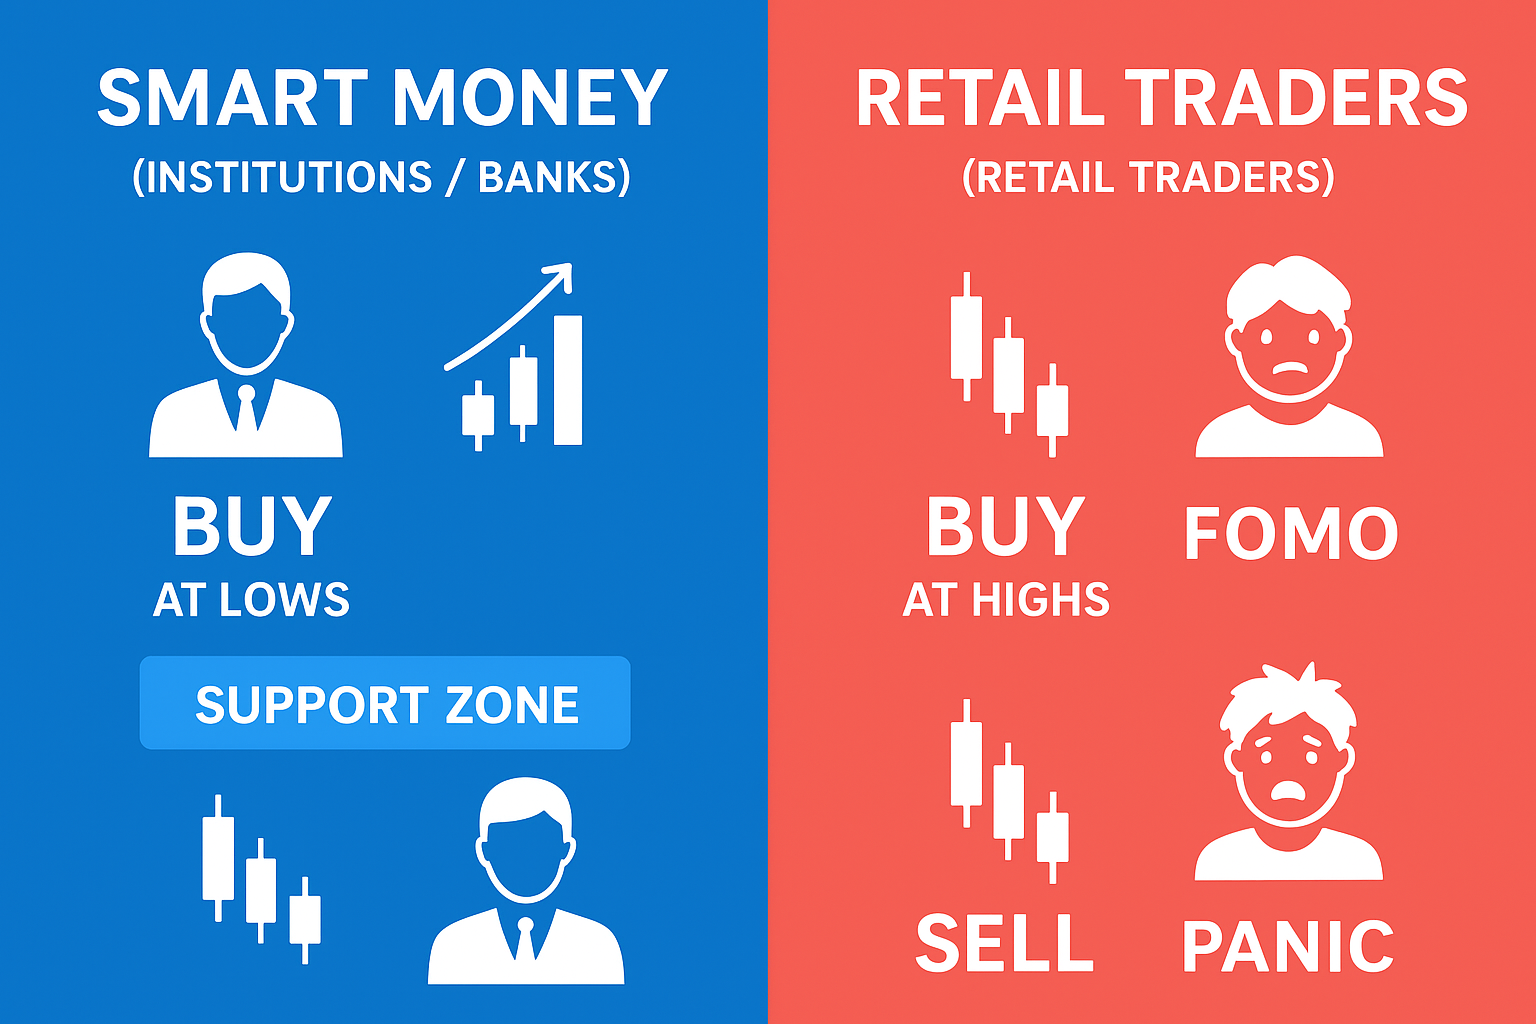
Smart Money (Institutions) vs Retail Traders - Understanding the difference
Why SMC Works
Institutional Advantage
Banks and institutions move billions. They leave clear footprints in price action that can be identified and traded.
Market Manipulation
Understanding liquidity sweeps and stop hunts allows you to anticipate reversals before they happen.
Understanding Market Structure
Market structure is the foundation of SMC trading. It defines the trend direction and helps identify potential reversal points. Mastering market structure allows you to trade with the trend and avoid counter-trend trades.
Bullish Market Structure
A bullish market structure is characterized by a series of Higher Highs (HH) and Higher Lows (HL). This indicates institutional buying pressure and an uptrend.
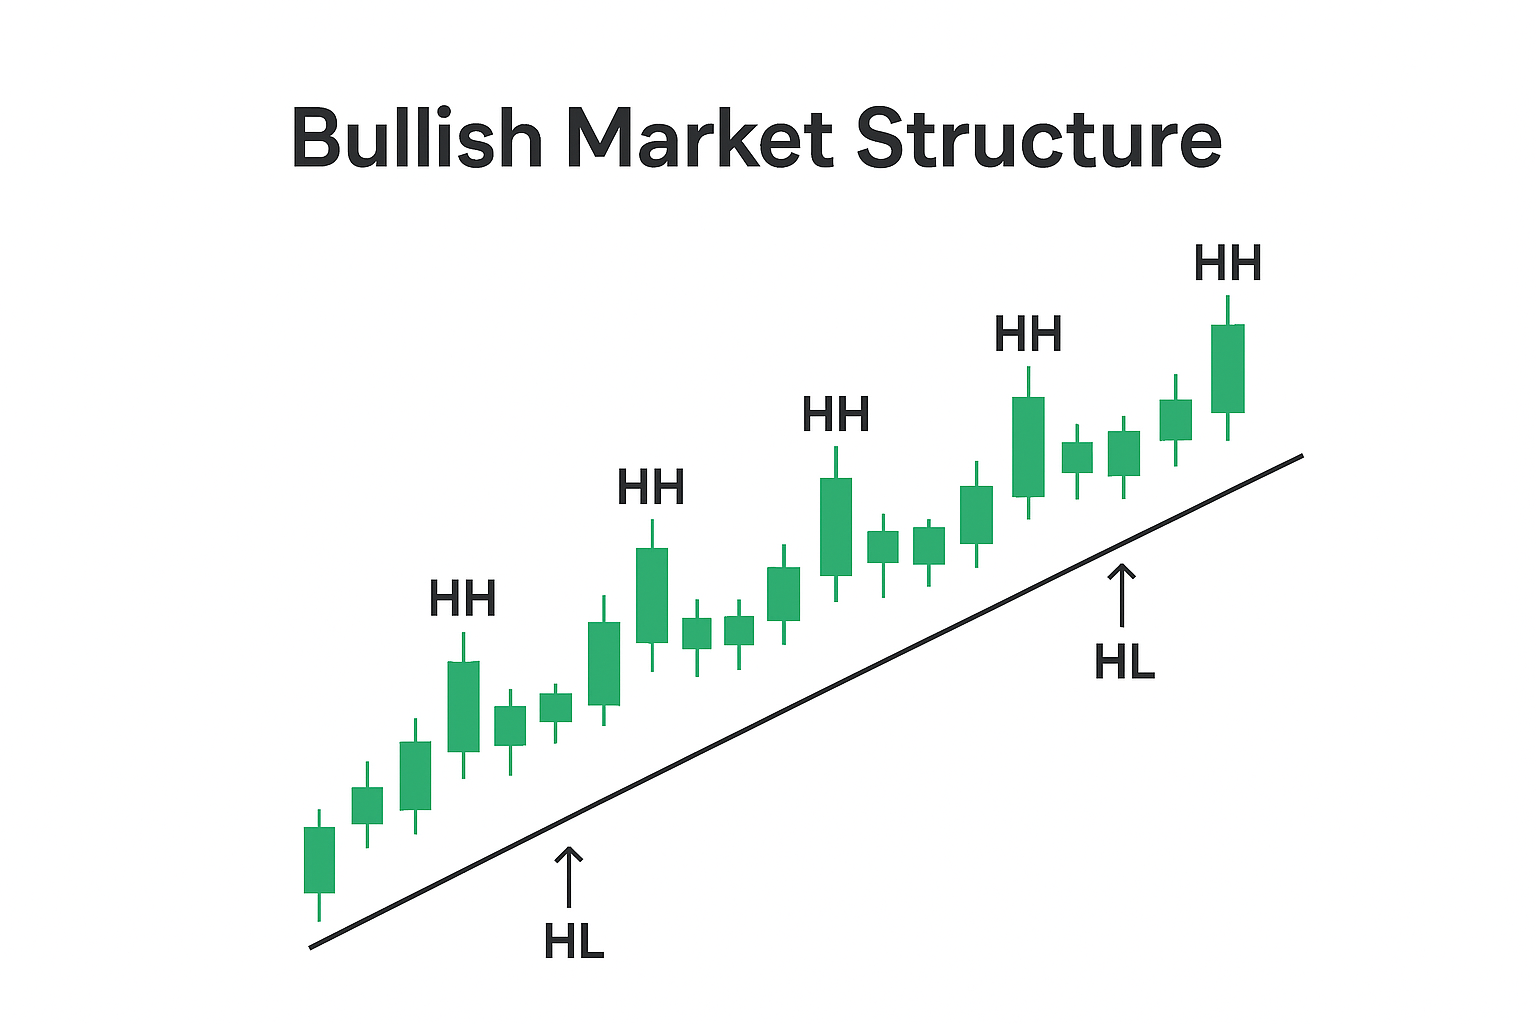
Bullish Market Structure: Higher Highs (HH) and Higher Lows (HL)
Bullish Structure Characteristics:
- Each swing high is higher than the previous high
- Each swing low is higher than the previous low
- Look for buying opportunities at higher lows
Bearish Market Structure
A bearish market structure shows Lower Highs (LH) and Lower Lows (LL), indicating institutional selling and a downtrend.
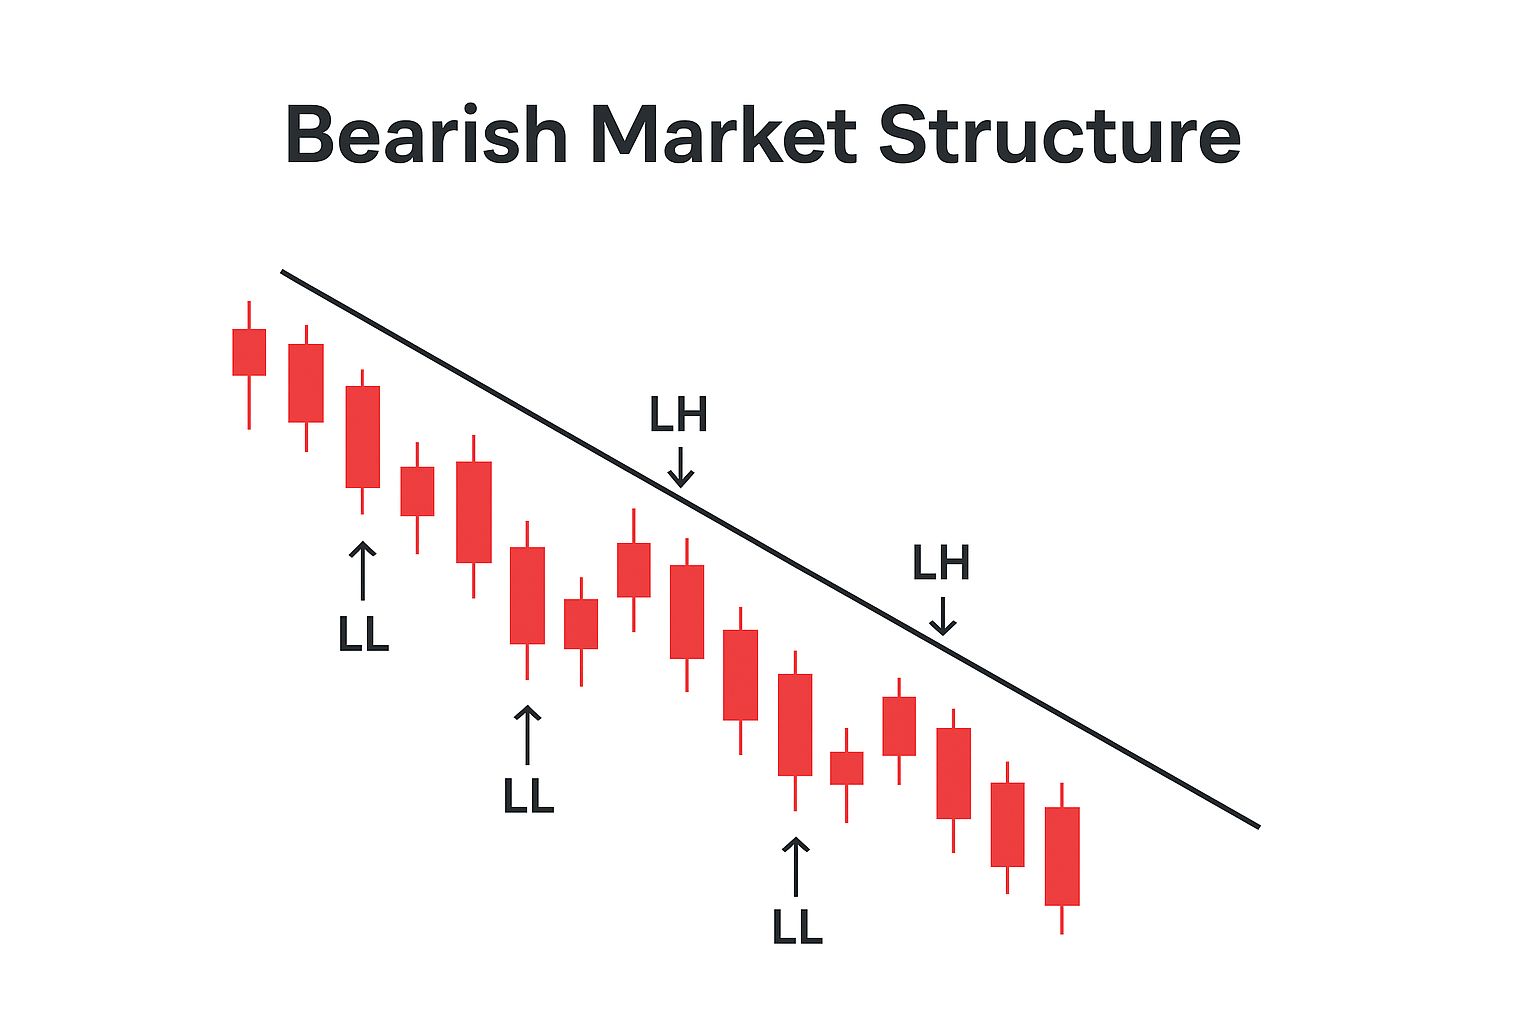
Bearish Market Structure: Lower Highs (LH) and Lower Lows (LL)
Bearish Structure Characteristics:
- Each swing high is lower than the previous high
- Each swing low is lower than the previous low
- Look for selling opportunities at lower highs
Order Blocks: Where Smart Money Enters
Order blocks are one of the most powerful concepts in SMC. They represent zones where institutional traders placed large orders, causing significant price movement. These zones often act as strong support or resistance when price returns to them.
📦 What is an Order Block?
An order block is the last bullish (or bearish) candle before a strong impulsive move. It marks the zone where institutions accumulated their positions before pushing price in their desired direction.
Bullish Order Block
A bullish order block forms during a downtrend when a strong bullish candle appears before price shoots upward. This candle represents institutional buying.
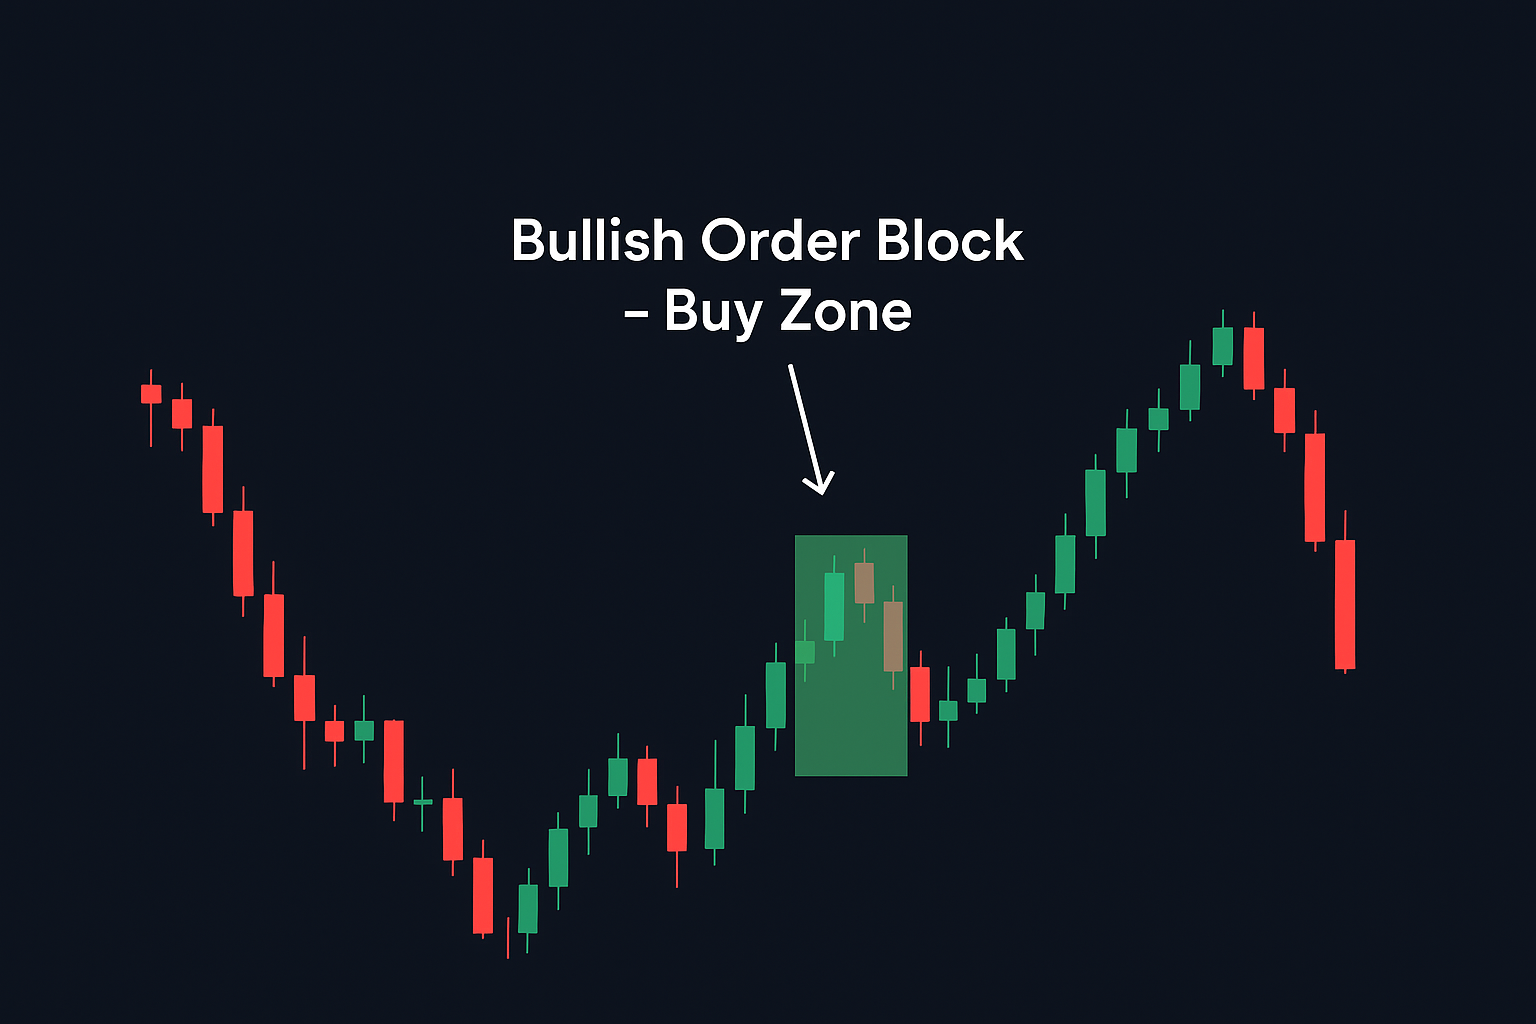
Bullish Order Block: The last down candle before a strong upward move
✅ How to Trade Bullish Order Blocks:
- Identify the order block: Find the last bearish candle before a strong bullish move
- Wait for price to return: Be patient for price to retrace back to this zone
- Look for confirmation: Watch for rejection wicks or bullish engulfing patterns
- Enter at 50% of the block: The optimal entry is at the midpoint of the order block
- Set stop loss below: Place SL below the order block with buffer
Bearish Order Block
A bearish order block forms during an uptrend when a strong bearish candle precedes a sharp downward move, indicating institutional selling.
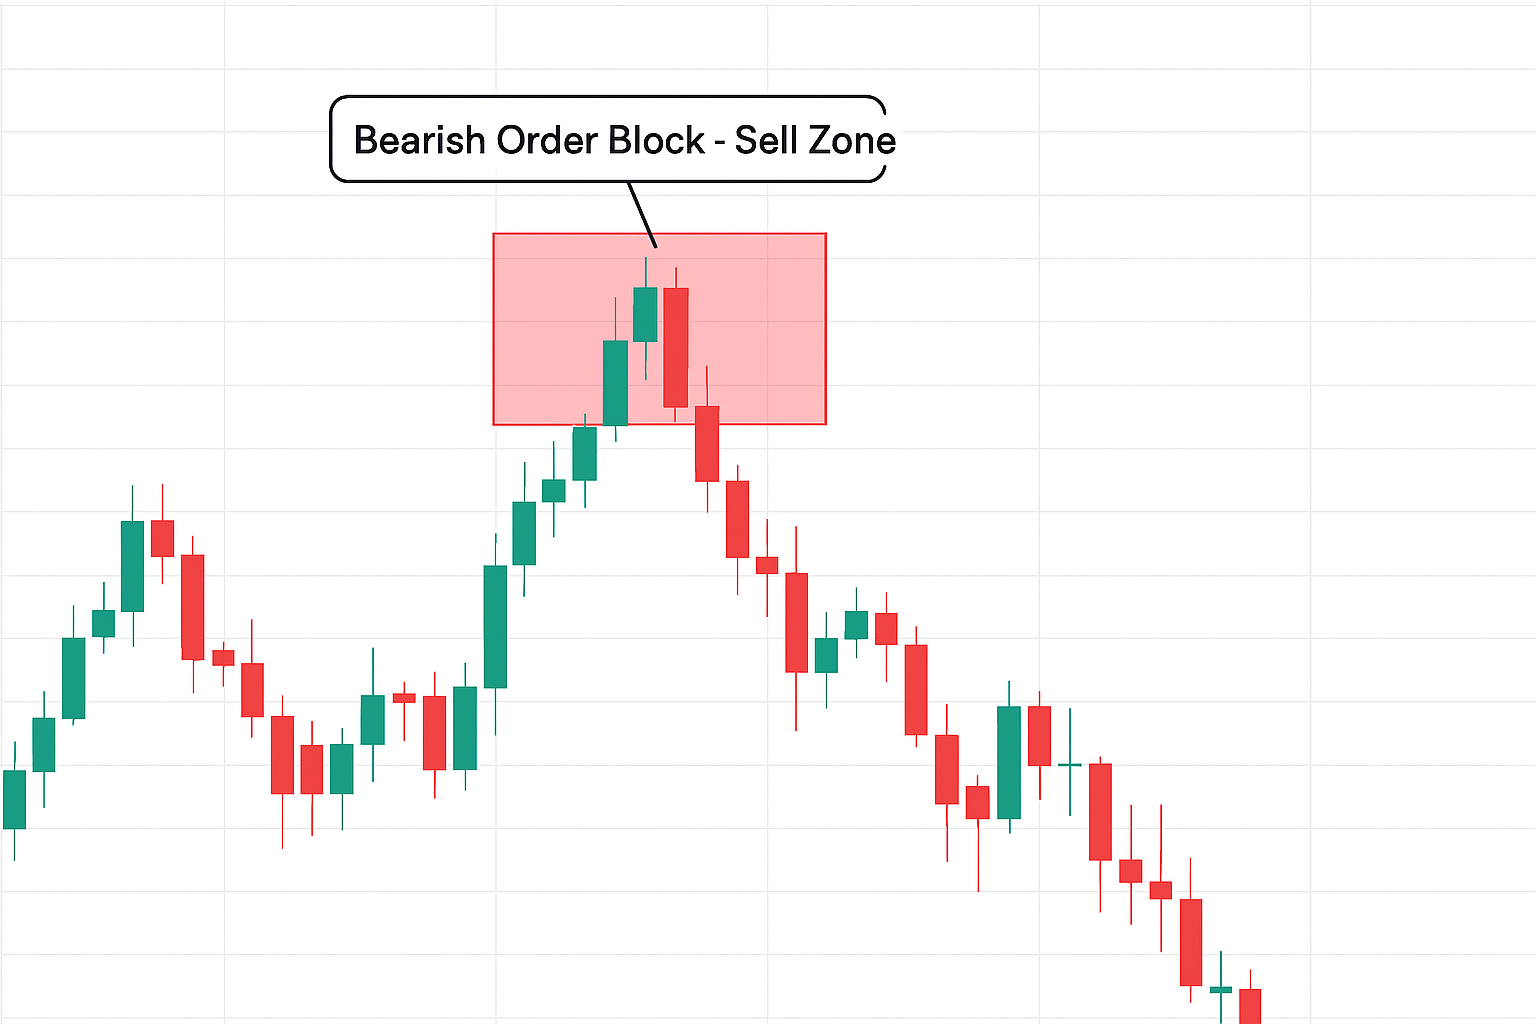
Bearish Order Block: The last up candle before a strong downward move
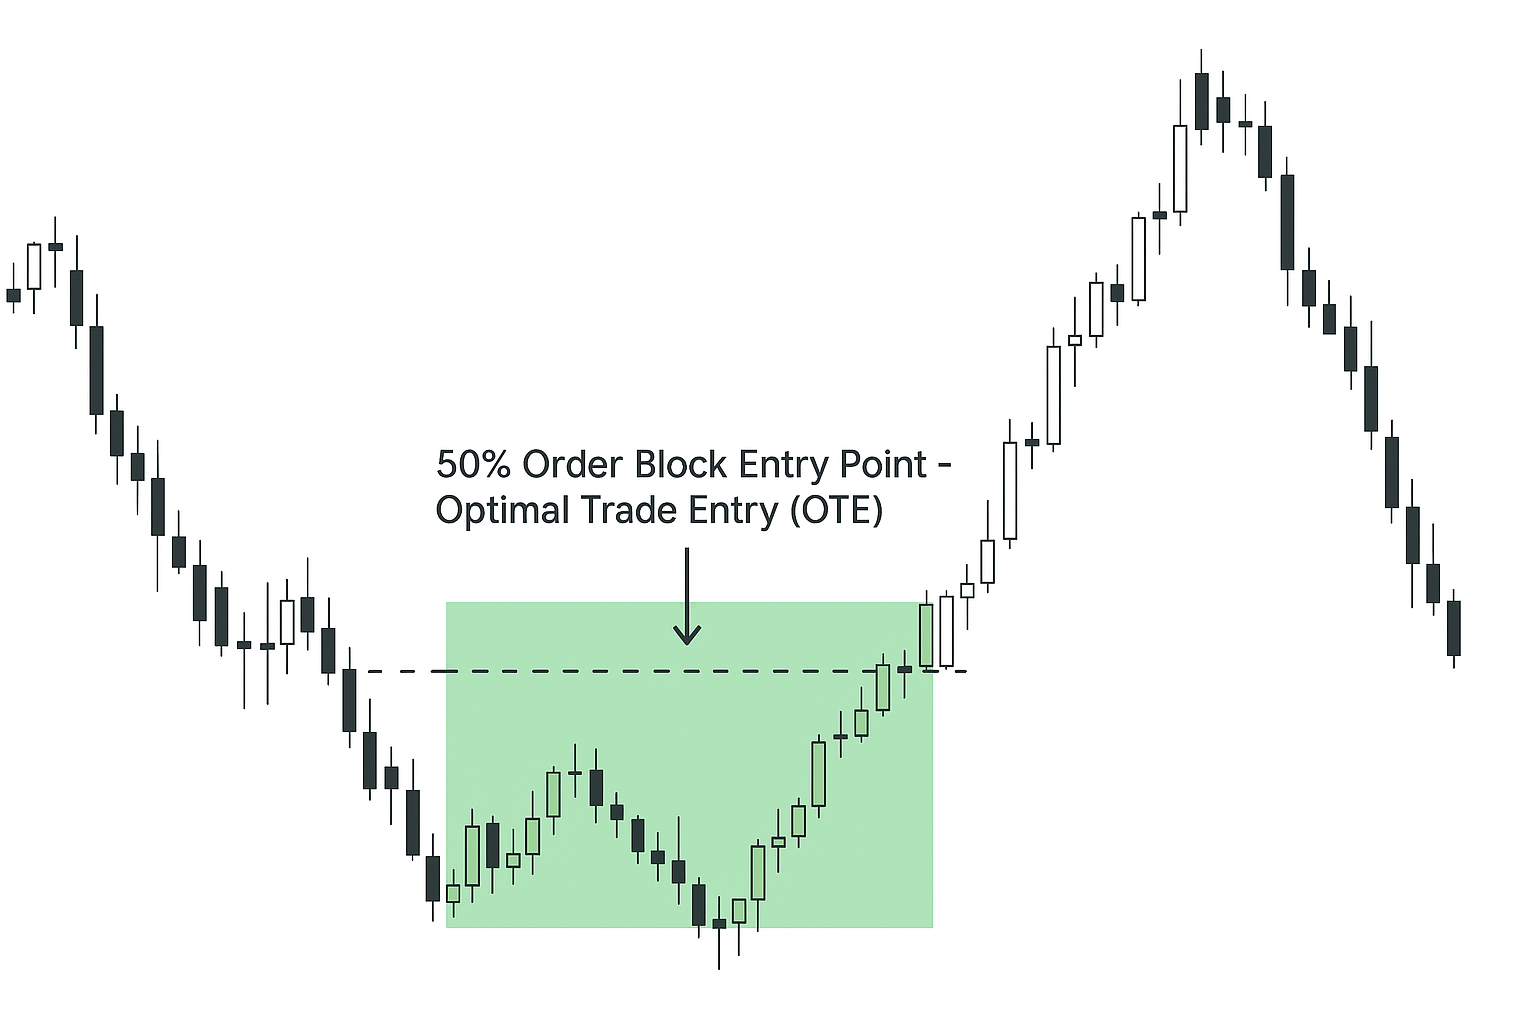
Optimal Trade Entry (OTE): Enter at 50% of the order block for best risk-reward
Fair Value Gaps (FVG): Market Imbalances
A Fair Value Gap (FVG), also called an imbalance, occurs when price moves so aggressively that it leaves a gap in the chart. This represents an area where orders were executed too quickly, leaving unfilled orders behind.
📊 FVG Definition:
A Fair Value Gap is created when there's no overlap between the wicks of three consecutive candles. The gap between candle 1's high/low and candle 3's low/high represents the FVG zone.
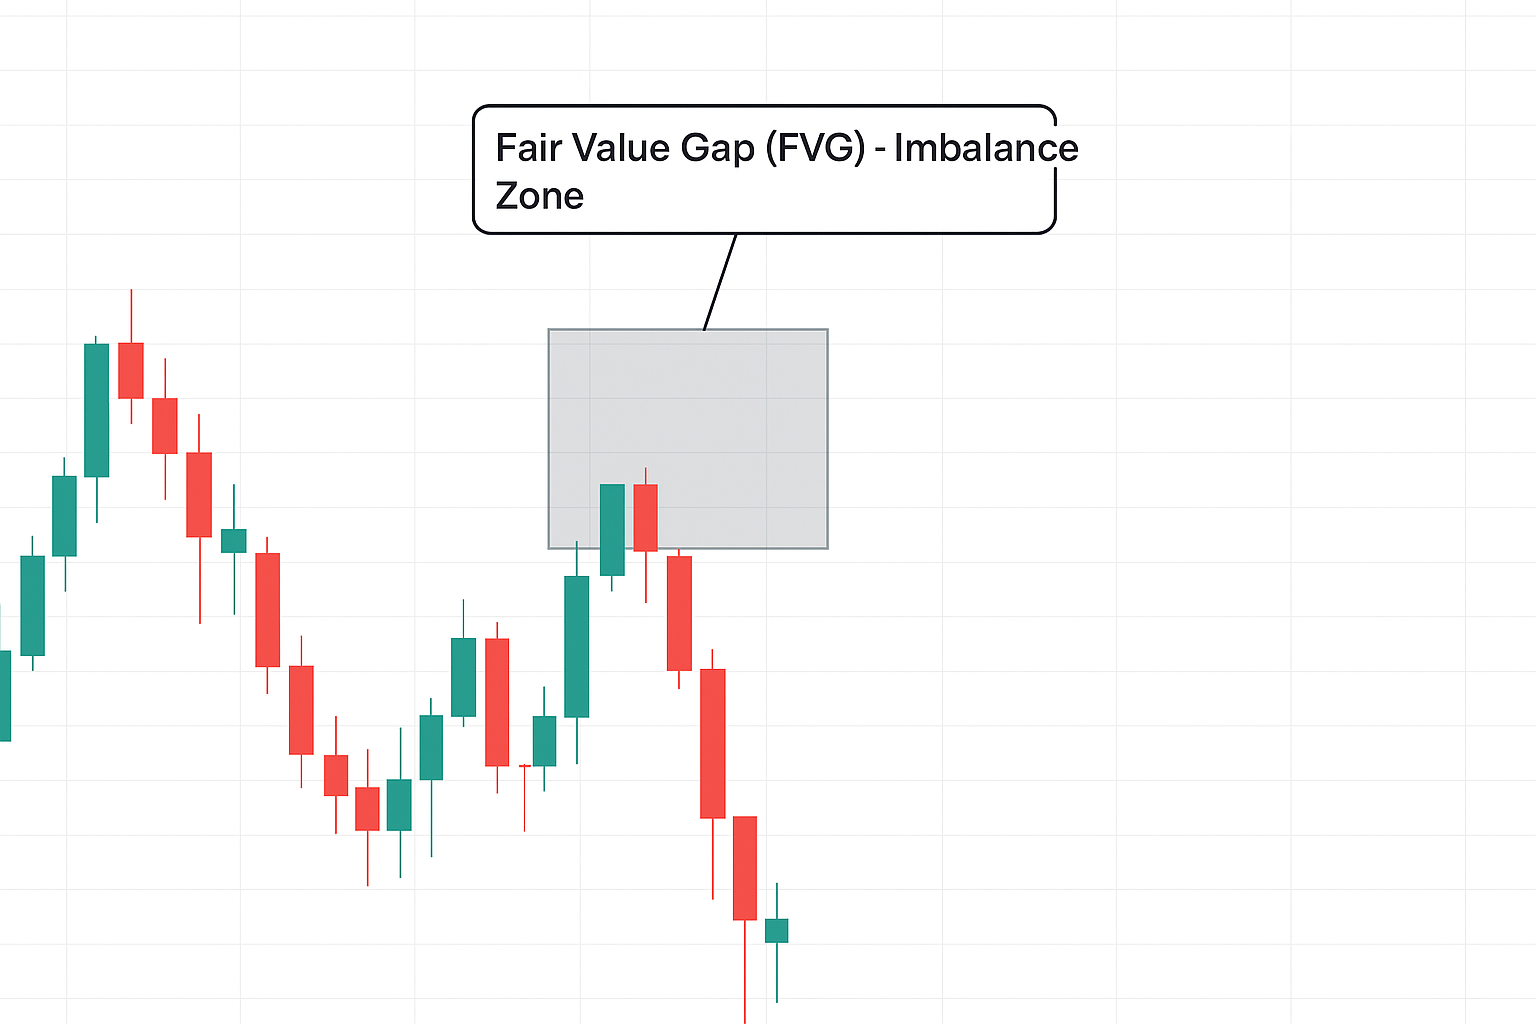
Fair Value Gap: Price moves so fast it creates an imbalance that often gets filled later
Why FVGs Matter
Price Magnet
FVGs act like magnets. Price tends to return to fill these imbalances, providing high-probability entry zones.
Institutional Footprints
Large FVGs indicate aggressive institutional trading, showing where smart money is positioned.
Trading FVG Strategy:
- Step 1: Identify FVG on higher timeframe (4H or Daily)
- Step 2: Wait for price to retrace into the FVG zone
- Step 3: Look for rejection on lower timeframe (15M or 1H)
- Step 4: Enter when price shows reversal confirmation
Break of Structure (BOS) & Change of Character (CHOCH)
BOS and CHOCH are critical concepts that help identify trend continuation and potential reversals. Understanding these patterns allows you to enter trades at optimal moments.
Break of Structure (BOS)
A Break of Structure occurs when price breaks through a significant high or low in the current trend. This confirms trend continuation and signals that institutions are still pushing price in the same direction.
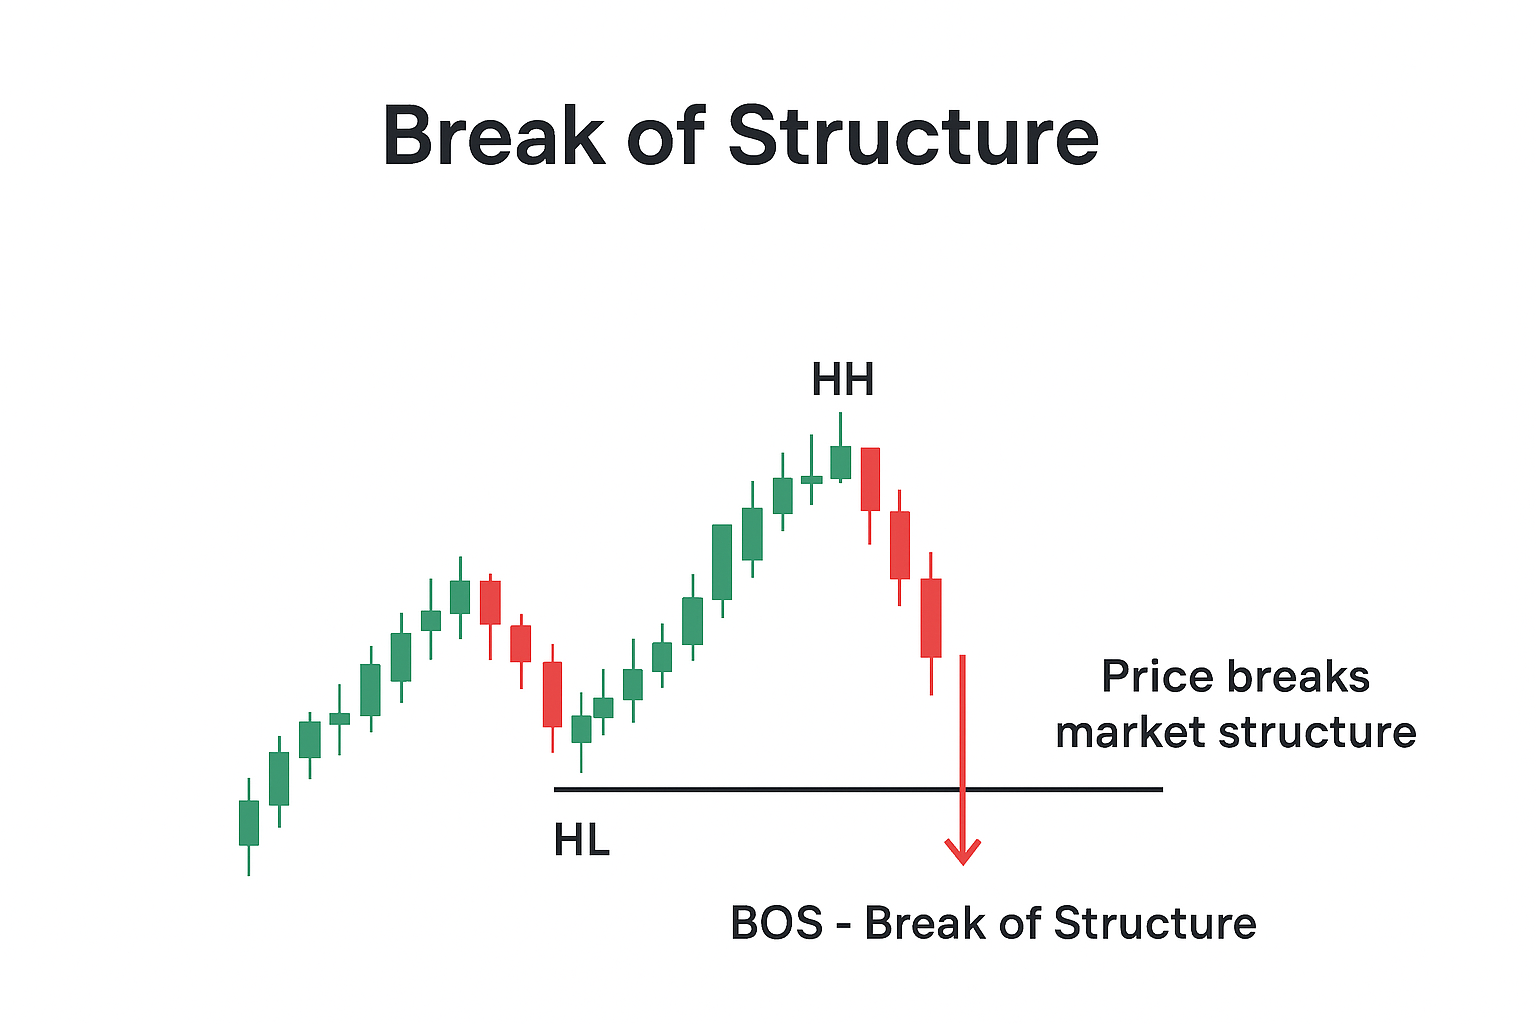
Break of Structure (BOS): Price breaks the previous high/low, confirming trend continuation
✅ Bullish BOS Characteristics:
- Price breaks above the previous swing high
- Confirms bullish market structure continuation
- Look for pullbacks to order blocks for entries
Change of Character (CHOCH)
A Change of Character is an early warning signal that the trend may be reversing. It occurs when price breaks an internal structure but not the overall trend structure.
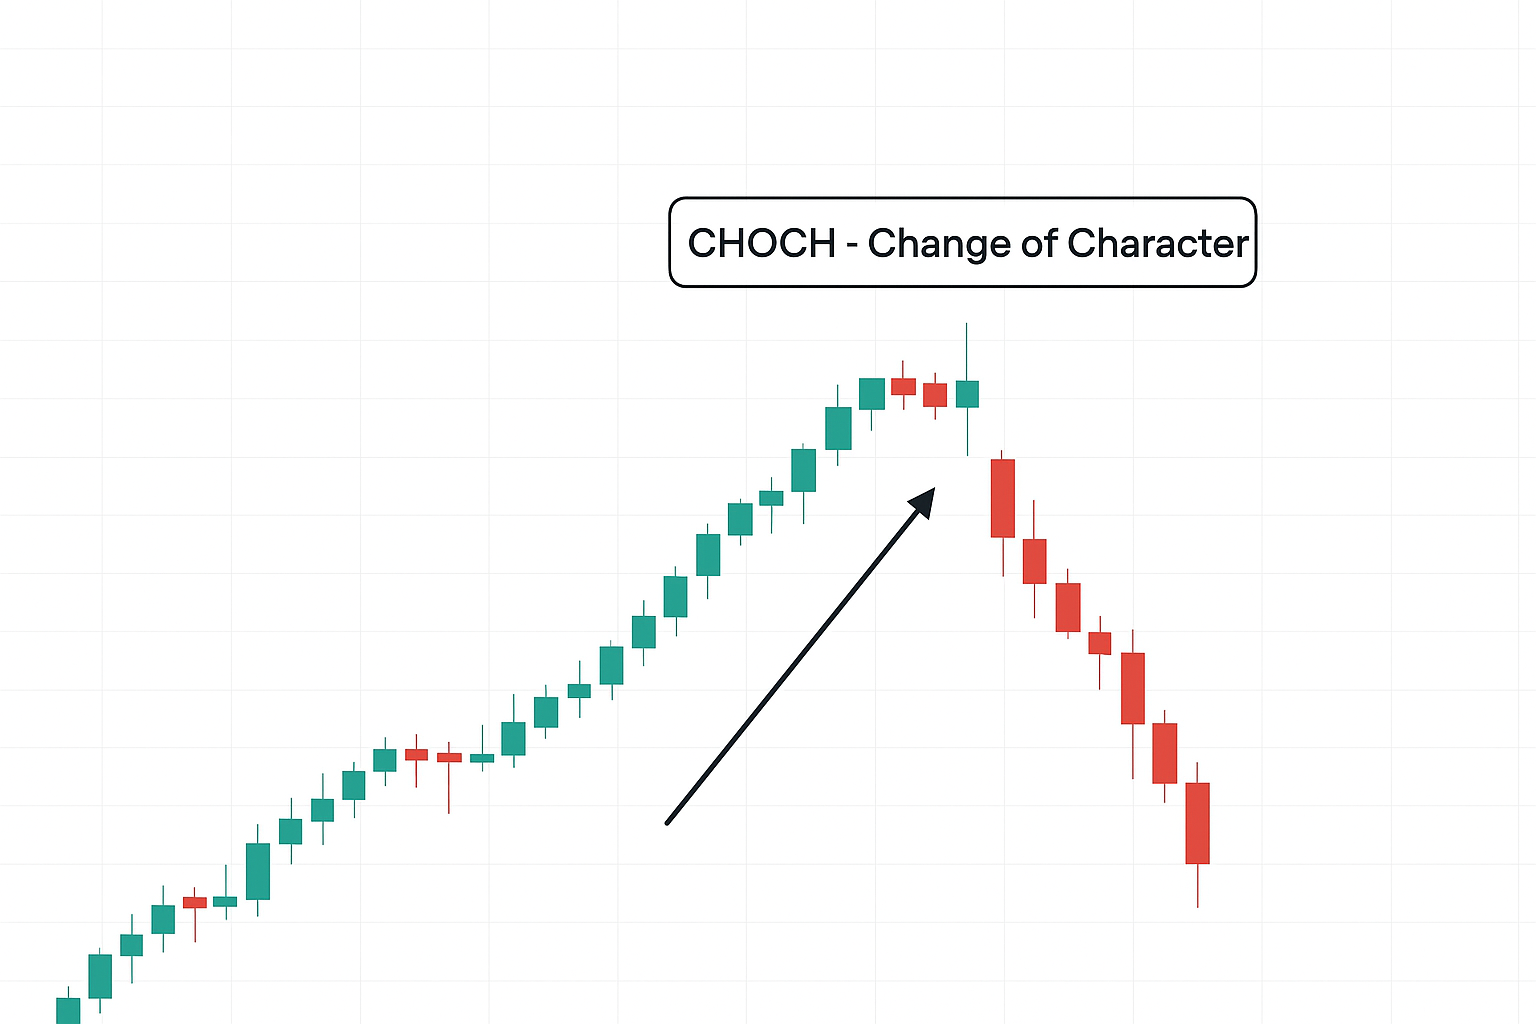
CHOCH: First sign of potential trend reversal - institutions changing direction
Key Differences: BOS vs CHOCH
| Aspect | BOS | CHOCH |
|---|---|---|
| Meaning | Trend continuation | Potential reversal |
| Break Level | Previous swing high/low | Internal structure |
| Trading Action | Enter in trend direction | Prepare for reversal |
Liquidity Pools: Where Stop Losses Are Hunted
Liquidity is the lifeblood of institutional trading. Banks need massive amounts of liquidity to fill their large orders. They create this liquidity by sweeping retail traders' stop losses before reversing in the intended direction.
💰 The Liquidity Game:
Retail traders place stop losses at obvious levels (swing highs/lows, round numbers, support/resistance). Institutions know this and deliberately push price to these levels to "grab liquidity" before the real move begins.
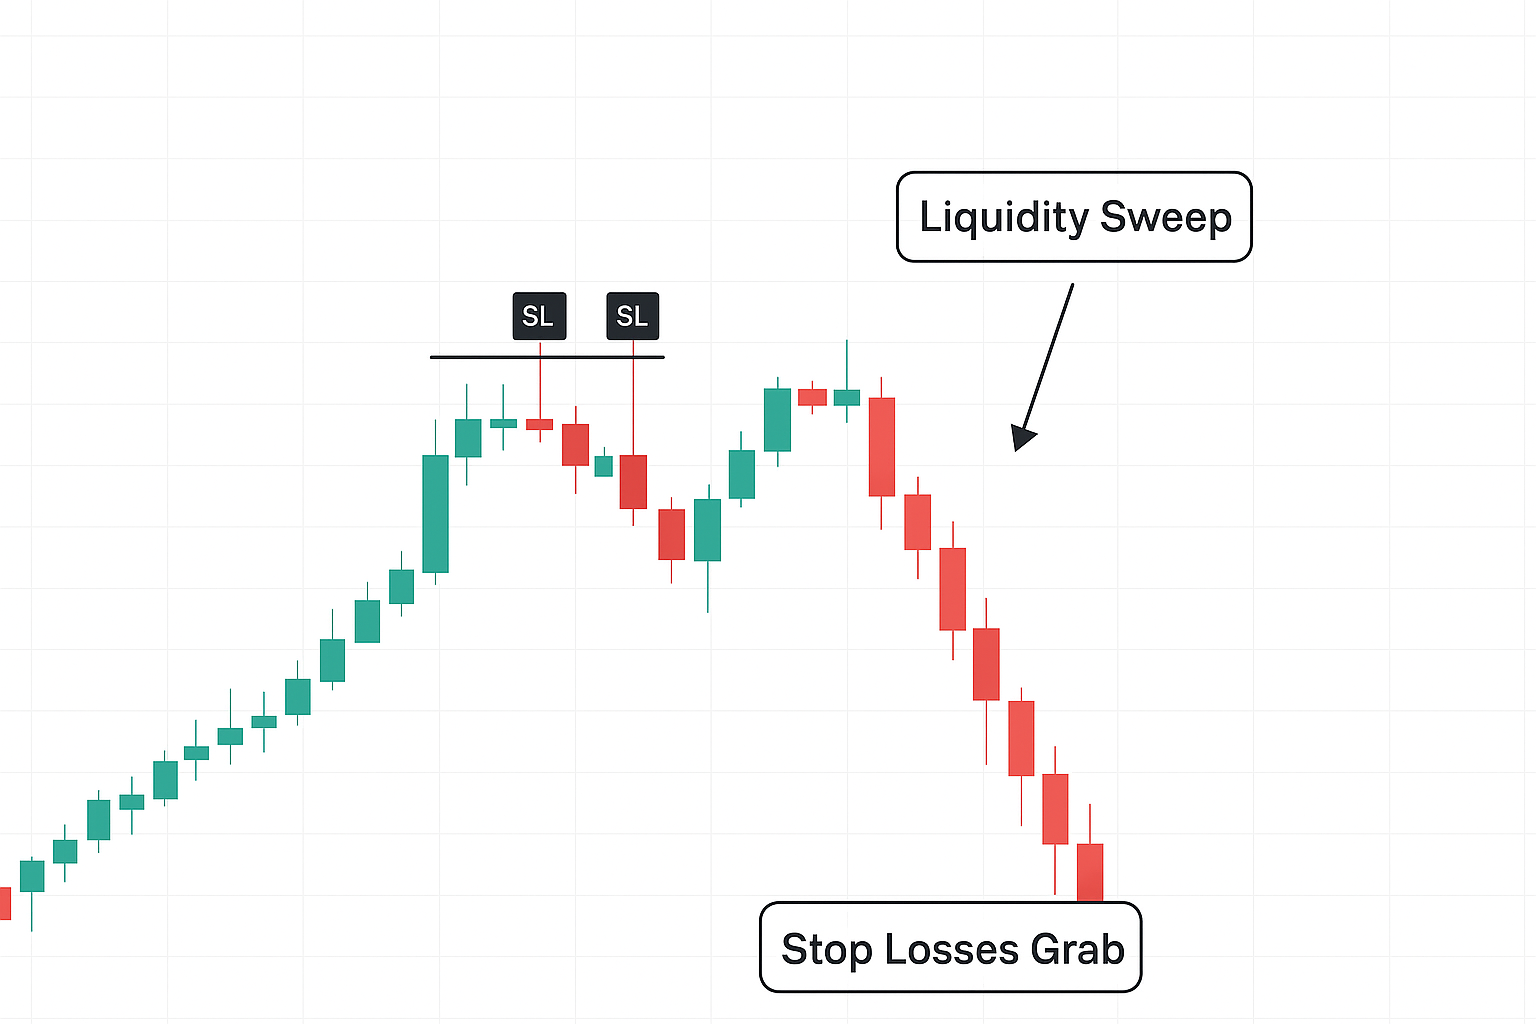
Liquidity Sweep: Price spikes to grab stop losses before reversing sharply
Where Liquidity Sits
Equal Highs/Lows
Multiple touches at same level = massive stop loss clusters
Round Numbers
1.3000, 1.2500 etc - psychological levels attract stops
Trend Lines
Obvious trend lines that retail traders use for stops
🎯 How to Trade Liquidity Sweeps:
- Identify liquidity pools: Look for equal highs/lows or obvious stop loss levels
- Wait for the sweep: Price quickly spikes through these levels (long wicks)
- Watch for rejection: Strong reversal candles after the sweep
- Enter on reversal: Trade in the opposite direction of the sweep
- Target opposite liquidity: Aim for the liquidity pool on the other side
Pro Tip: Double Liquidity Sweeps
Sometimes institutions sweep liquidity on both sides (buy stops above AND sell stops below) before making the real move. This is called a "double sweep" or "liquidity grab on both sides" and provides extremely high-probability setups.
Complete SMC Trading Strategy
Now that you understand the individual components, let's combine them into a complete, actionable trading strategy. This step-by-step approach will help you identify high-probability SMC setups.
Complete SMC Setup: All elements combined for a high-probability trade
Step-by-Step SMC Trading Process
Identify Market Structure (Higher Timeframe)
Start on Daily or 4H chart. Is price making higher highs/lows (bullish) or lower highs/lows (bearish)? Define the overall trend direction.
Mark Key Order Blocks
Identify the last bullish/bearish candle before significant moves. These are your potential entry zones.
Spot Liquidity Pools
Look for equal highs/lows, round numbers, or obvious stop loss levels. This is where institutions will hunt.
Wait for BOS or CHOCH
BOS = trend continuation (trade with trend). CHOCH = potential reversal (wait for confirmation).
Price Retraces to Order Block
Wait patiently for price to pull back to your marked order block or FVG. Do NOT chase price!
Entry Confirmation (Lower Timeframe)
Drop to 15M or 1H chart. Look for rejection wicks, engulfing candles, or mini BOS in your direction from the order block.
Execute Trade
Enter at 50% of order block. Stop loss below/above order block. Take profit at opposite liquidity or previous structure.
Multi-Timeframe Analysis
SMC trading requires analyzing multiple timeframes to get the complete picture. Here's the optimal timeframe approach:
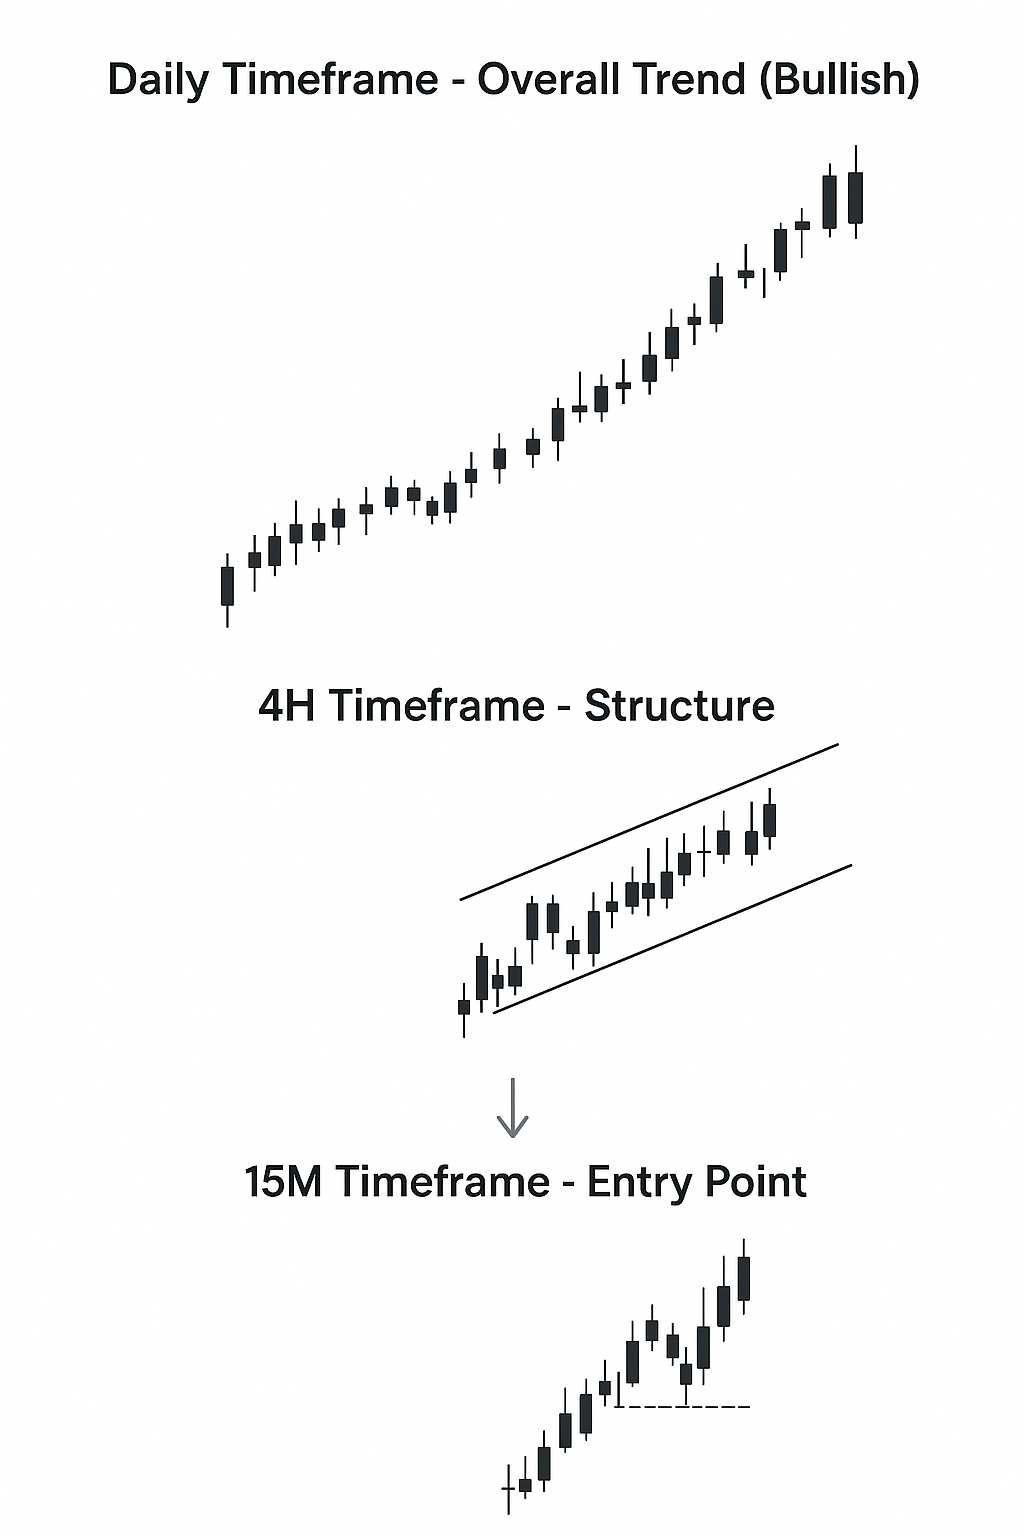
Top-Down Analysis: Daily → 4H → 1H → 15M for complete market picture
📈 Daily/4H
Purpose: Trend direction
- • Overall market structure
- • Major order blocks
- • Key liquidity levels
📊 1H/4H
Purpose: Entry zones
- • Refined order blocks
- • Fair value gaps
- • BOS/CHOCH signals
⚡ 15M/1H
Purpose: Precise entry
- • Entry confirmation
- • Exact entry point
- • Stop loss placement
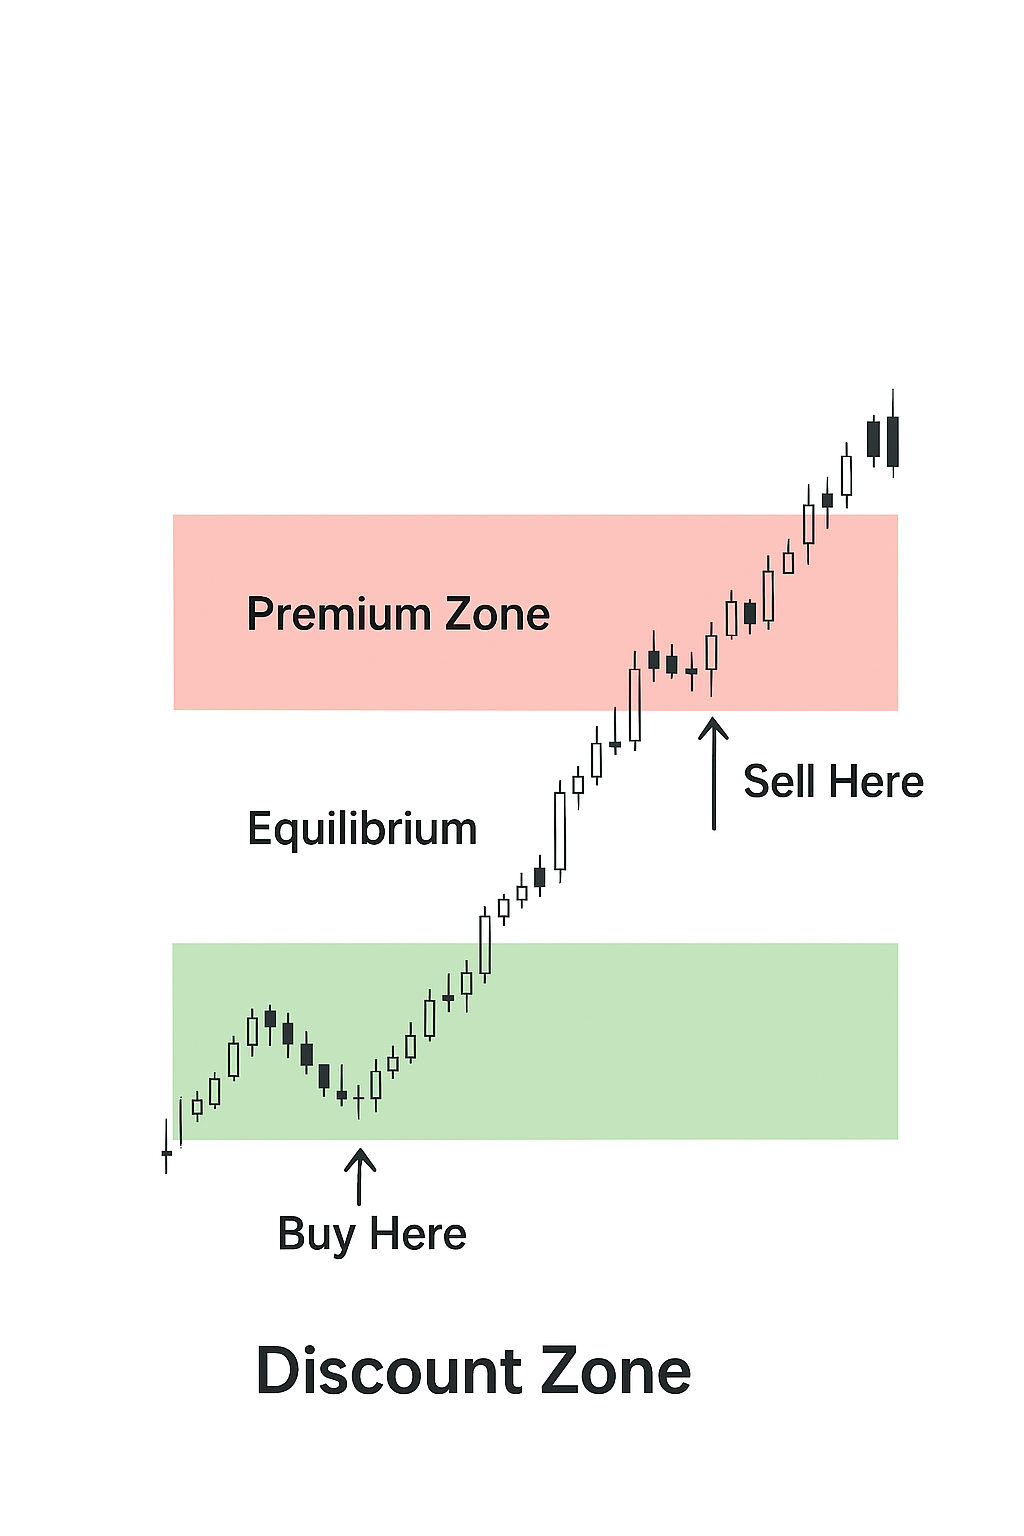
Premium & Discount Zones: Buy in discount (low), sell in premium (high)
Risk Management in SMC Trading
Even the best SMC setups require proper risk management. Here's how to protect your capital while trading Smart Money Concepts.
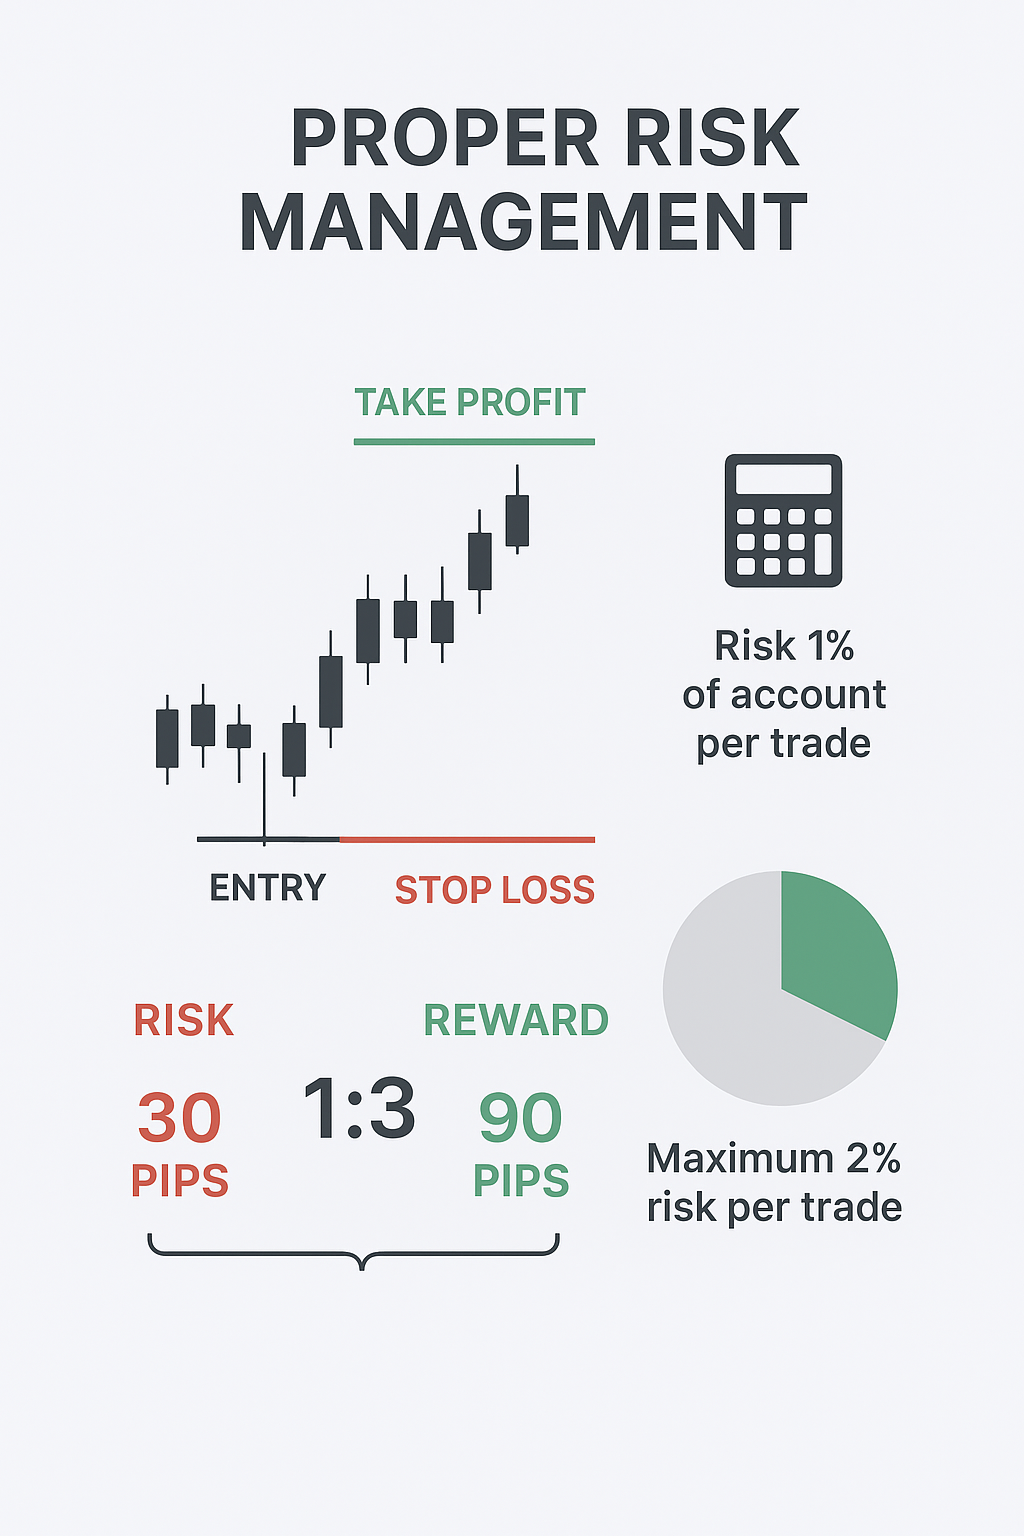
Proper Risk Management: Risk 1-2% per trade with 1:3 minimum risk-reward
Position Sizing
- • Risk 1-2% per trade maximum
- • Calculate lot size based on stop loss distance
- • Never risk more because "it looks good"
- • Scale position size with account growth
Risk-Reward Ratios
- • Minimum 1:3 risk-reward ratio
- • Aim for 1:5 or higher on best setups
- • Take partial profits at 1:2 if desired
- • Let winners run to opposite liquidity
📍 Stop Loss Placement
- Buy trades: Place stop loss 5-10 pips below the order block
- Sell trades: Place stop loss 5-10 pips above the order block
- Never move SL closer - give the trade room to breathe
- Trail SL to breakeven after price moves 1:1 in your favor

Best SMC Trading Times: London Open (8am GMT) & New York Open (1pm GMT)
⏰ Best Times to Trade SMC
London Session (8:00-12:00 GMT): High volatility, strong institutional activity, best for GBPUSD and EURUSD
New York Open (13:00-17:00 GMT): US institutions enter, liquidity sweeps common, excellent for all major pairs
London-NY Overlap (13:00-16:00 GMT): Peak liquidity and volatility, best time for SMC setups
Avoid Asian Session: Lower volatility, SMC signals less reliable during Tokyo hours
Common SMC Trading Mistakes to Avoid
Many traders struggle with SMC initially because they make these common mistakes. Learn from others' errors and accelerate your learning curve.
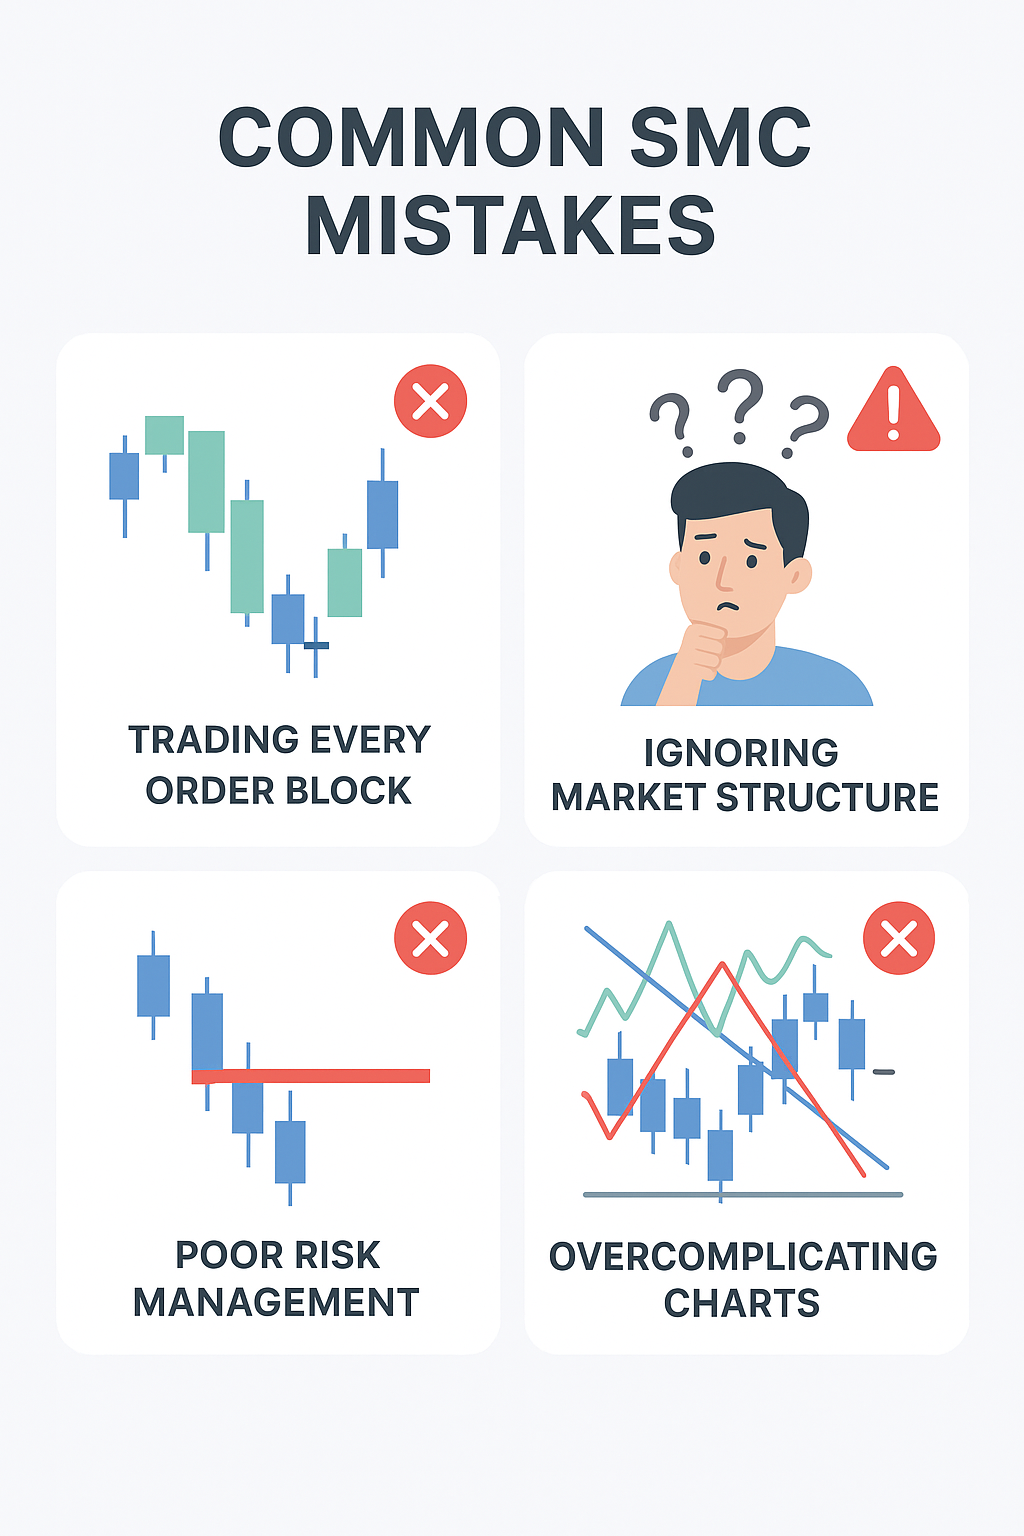
Top SMC Mistakes: Trading every order block, ignoring structure, poor risk management
Mistake #1: Trading Every Order Block
The Problem: Not all order blocks are equal. Many will fail.
Solution: Only trade order blocks that align with higher timeframe structure and have confluence with FVGs or liquidity sweeps.
Mistake #2: Overcomplicating Your Charts
The Problem: Drawing too many lines, boxes, and zones makes analysis paralysis.
Solution: Keep it simple. Mark only the most recent and relevant order blocks (last 2-3). Remove old zones.
Mistake #3: Ignoring Market Structure
The Problem: Trading order blocks against the higher timeframe trend.
Solution: Always start with HTF structure. Trade with the trend, not against it. Wait for BOS confirmation.
Mistake #4: Chasing Price / FOMO Entries
The Problem: Entering too late because you fear missing the move.
Solution: Patience is key in SMC. Wait for price to come to your order block. If you miss it, wait for the next setup.
Mistake #5: Poor Risk Management
The Problem: Risking too much because "this setup is guaranteed."
Solution: No setup is guaranteed. Always risk 1-2% maximum per trade. Protect your capital first.
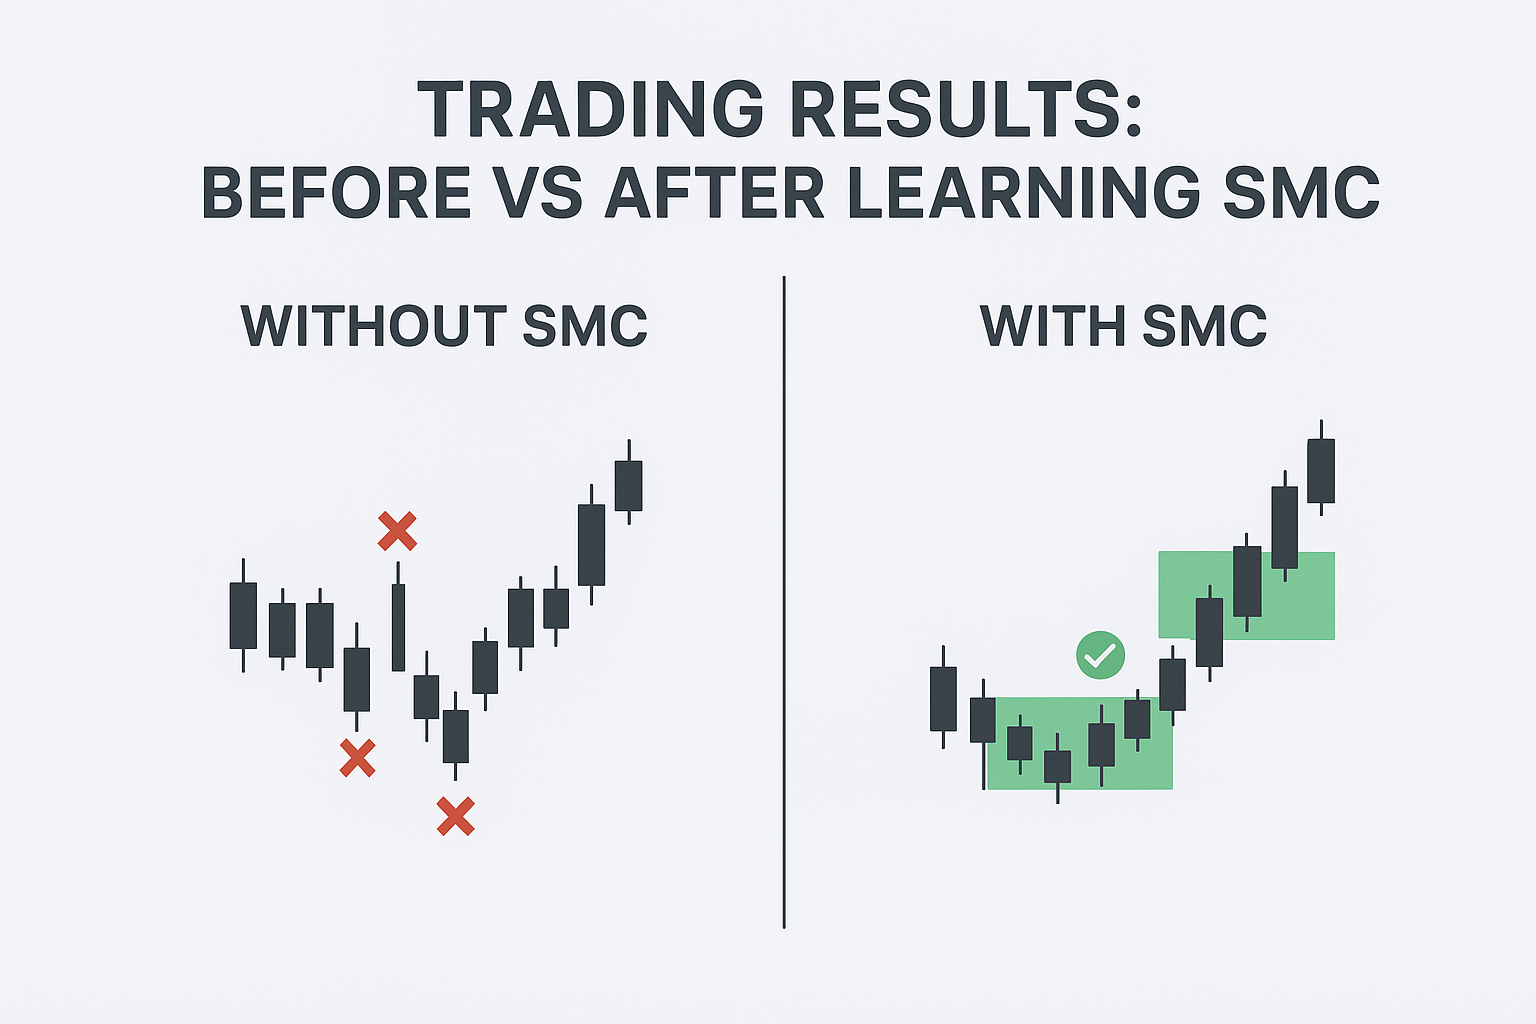
Trading Results: Before vs After Mastering Smart Money Concepts
Getting Started with Smart Money Concepts
Smart Money Concepts represents a paradigm shift in how we approach forex trading. By understanding institutional behavior and identifying their footprints in the market, you can trade alongside the "smart money" instead of being their liquidity.
Key Takeaways
- Market structure defines the overall trend direction
- Order blocks mark institutional entry zones
- Fair Value Gaps attract price like magnets
- BOS confirms continuation, CHOCH signals potential reversal
- Liquidity sweeps reveal institutional manipulation
- Multi-timeframe analysis is crucial for success
- Risk 1-2% per trade with 1:3 minimum RR
- Patience and discipline separate winners from losers
Your SMC Learning Path
Mastering Smart Money Concepts takes time and practice. Here's a realistic roadmap:
Weeks 1-2: Theory & Chart Practice
Study SMC concepts daily. Mark order blocks, structure, and liquidity on past charts. No live trading yet.
Weeks 3-4: Demo Trading
Start taking SMC setups on demo account. Focus on following your rules, not on profit. Journal every trade.
Months 2-3: Micro Live Trading
Move to live account with smallest position sizes. Get used to real money emotions while risking minimal capital.
Month 4+: Scale Gradually
If consistently profitable, slowly increase position size. Never rush this process. Consistency over time = success.
Ready to Trade with Professional Signals?
While you're mastering SMC, let our expert team provide you with high-probability trading signals using Smart Money Concepts and institutional analysis.
Continue Your Trading Education
Smart Money Concepts works best when combined with solid risk management, trading psychology, and a complete trading plan. Explore our other educational resources to become a well-rounded trader.
Related Articles
Was this article helpful? Share it with fellow traders!
Back to All Articles