Backtesting Trading Strategies:Complete Guide 2026
Complete guide to backtesting trading strategies with data quality, metrics, overfitting, and validation. Professional FAQs and 2026 best practices for strategy testing.
What is Backtesting?
Backtesting is the systematic process of applying a trading strategy to historical price (and optionally fundamental) data to evaluate how it would have performed had it been traded in the past. It is the standard method used by quantitative funds, systematic traders, and serious discretionary traders to validate ideas, size positions, and estimate risk and return before committing capital.
A proper backtest simulates every step a live system would take: signal generation, order placement, fill assumptions (including slippage and costs), position management, and risk limits. When execution assumptions and data quality are realistic, backtest results provide a baseline expectation for live performance—though past performance never guarantees future results. In 2026, backtesting remains a cornerstone of professional strategy development for both discretionary and algorithmic approaches.
What you'll learn in this guide:
- Why data quality is non-negotiable and how to source and validate it
- Key metrics: total return, drawdown, Sharpe ratio, win rate, profit factor, and how to use them together
- Overfitting and curve-fitting—causes, consequences, and how to reduce them
- Walk-forward analysis and out-of-sample validation workflows
- Common backtesting mistakes and how to avoid them
- 2026 best practices and a complete professional FAQs section
Why Backtest Your Strategy?
Backtesting allows you to validate trading ideas without risking capital, compare multiple strategies on a level playing field, and set realistic expectations for returns, drawdowns, and trade frequency. It is the primary gate between concept and live deployment—used by institutional and retail traders alike.
Benefits include: (1) Objective comparison—same data, same period, same cost assumptions for every strategy; (2) Risk awareness—you see maximum drawdown, losing streaks, and correlation to market regimes before going live; (3) Parameter and rule refinement—within the bounds of avoiding overfitting; (4) Documentation—a clear record of what the strategy does and how it was tested. Skipping a rigorous backtest (and out-of-sample validation) significantly increases the chance of costly surprises in live trading.
Data Quality for Backtesting
Data quality is the foundation of any credible backtest. Poor or biased data can make a losing strategy appear profitable or hide real edge. Institutional-grade backtesting demands verified sources, consistent timezone and session handling, and explicit handling of corporate actions and survivorship bias.
Common issues include: Gaps and bad ticks—missing bars or obvious outliers that distort returns; unadjusted prices—splits and dividends not reflected, leading to false moves; survivorship bias—testing only on names that exist today, excluding delisted losers; look-ahead bias—using information that would not have been available at trade time; timezone and session mismatches—e.g. mixing exchange close with UTC or forex session cutoffs incorrectly. Each of these can materially skew results.
Professional data checklist
- • Use adjusted OHLC (or apply adjustments yourself) for splits and dividends; document the adjustment method.
- • Match timeframe and session to your trading (e.g. forex session vs exchange hours; bar alignment to open/close).
- • Check for gaps, outliers, and bad ticks; filter or correct before backtesting.
- • Avoid survivorship bias: use survivorship-bias-free datasets or include delisted/failed instruments where relevant.
- • Document data source, history range, and any filters (e.g. liquidity, listing venue) for reproducibility.
Key Backtesting Metrics
Professional backtests are evaluated with a suite of metrics, not a single number. Total return alone is misleading—it ignores risk, drawdown, and trade frequency. The following metrics should be reported together and interpreted in context of your strategy type and asset class.
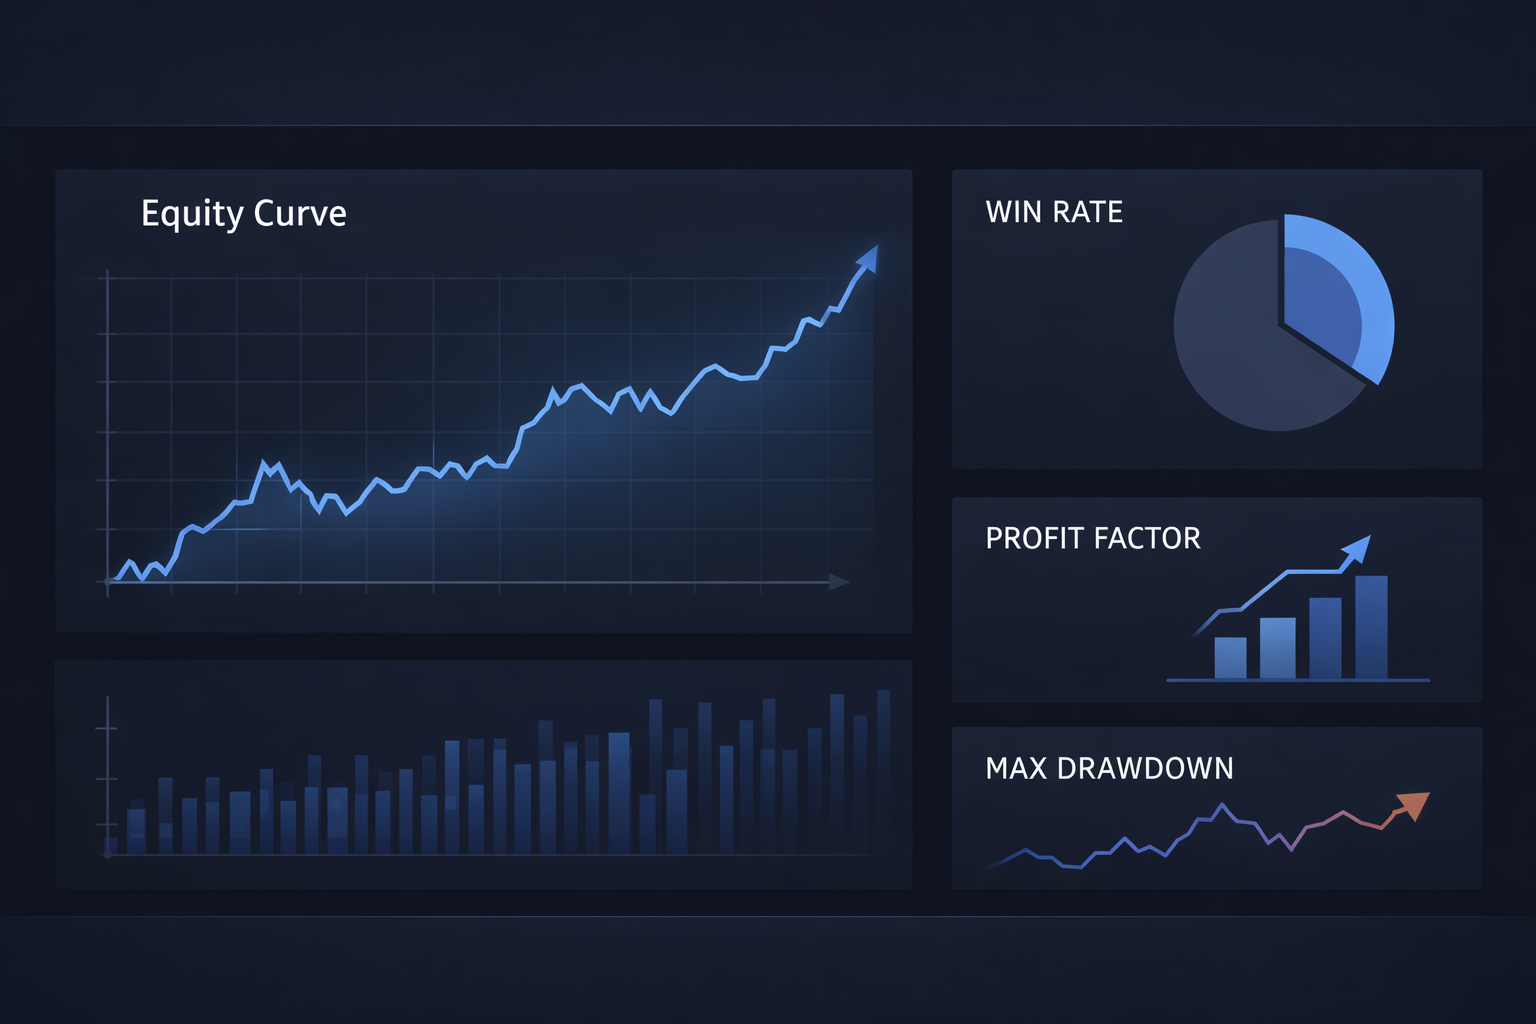
Return & drawdown
Total return and annualized return over the test period. Maximum drawdown (peak-to-trough decline) and average drawdown. Time underwater (percentage of days in drawdown). These set expectations for capital at risk and recovery time.
Risk-adjusted & trade statistics
Sharpe ratio (excess return per unit of volatility; annualized). Sortino ratio (downside volatility only). Win rate (percentage of profitable trades). Profit factor (gross profit / gross loss). Number of trades—enough for statistical relevance. Use these to compare strategies and spot overfitting (e.g. very high Sharpe in-sample, collapse out-of-sample).
Interpreting Backtest Results
Interpreting backtest results correctly is as important as running the test. Focus on the full picture: return, drawdown, risk-adjusted metrics, and trade count. Single-metric optimization (e.g. maximizing return) leads to fragile strategies.
Compare in-sample vs out-of-sample performance. If Sharpe, return, or win rate drop sharply out-of-sample, overfitting is likely. Check that the number of trades is sufficient for the metrics to be meaningful (e.g. 30+ for basic stats, 100+ for Sharpe stability). Use Monte Carlo or confidence intervals to assess how stable the outcome distribution is. Finally, ensure all reported metrics assume realistic costs and slippage—results before costs are not actionable.

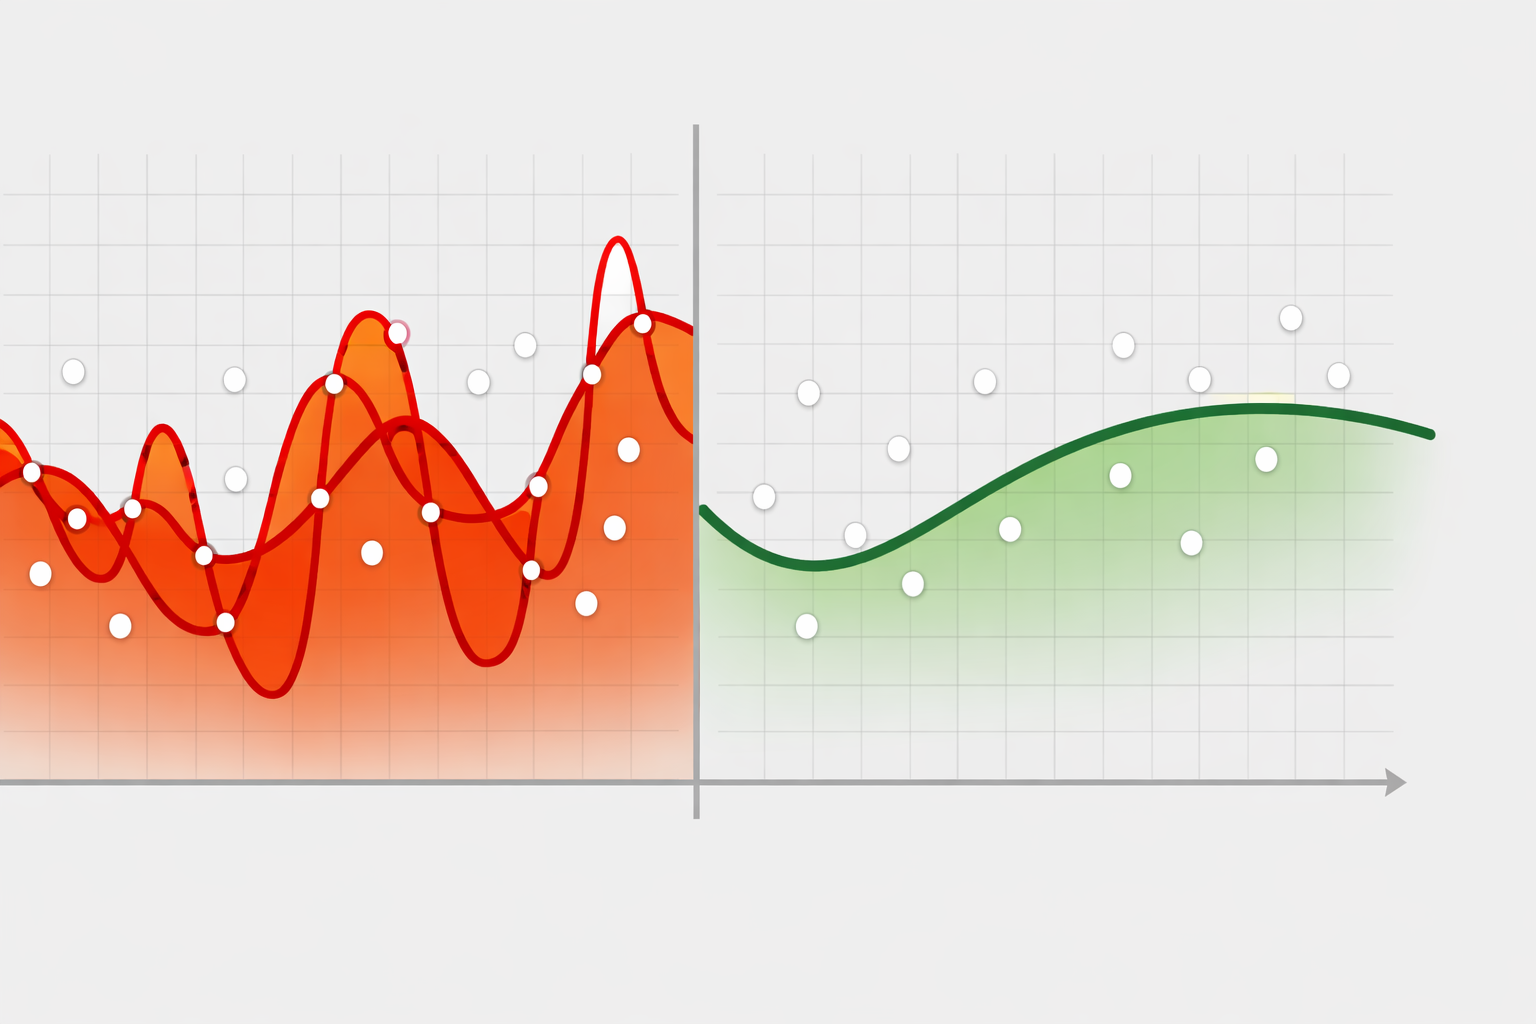
Overfitting and Curve-Fitting
Overfitting occurs when a strategy is tuned so closely to historical data that it captures noise rather than a repeatable edge. The backtest looks excellent; live performance collapses. Curve-fitting is the same idea applied to parameter optimization—too many parameters or too much tuning on one dataset leads to rules that do not generalize.
Red flags include: in-sample performance far better than out-of-sample; strategy working on only one symbol or one period; very high Sharpe (e.g. >2) after costs; many parameters relative to number of trades. The goal is a strategy that holds up across multiple markets, time periods, and out-of-sample tests.
Ways to reduce overfitting
- • Use walk-forward analysis: repeatedly train on one window, test on the next; never optimize on the test window.
- • Reserve a fixed out-of-sample period (e.g. 20–30% of history) and use it only for final evaluation.
- • Prefer fewer, interpretable parameters; avoid complex models with many degrees of freedom.
- • Test across multiple assets, timeframes, and market regimes; require consistency.
- • Use Monte Carlo or bootstrap to check robustness of key metrics.
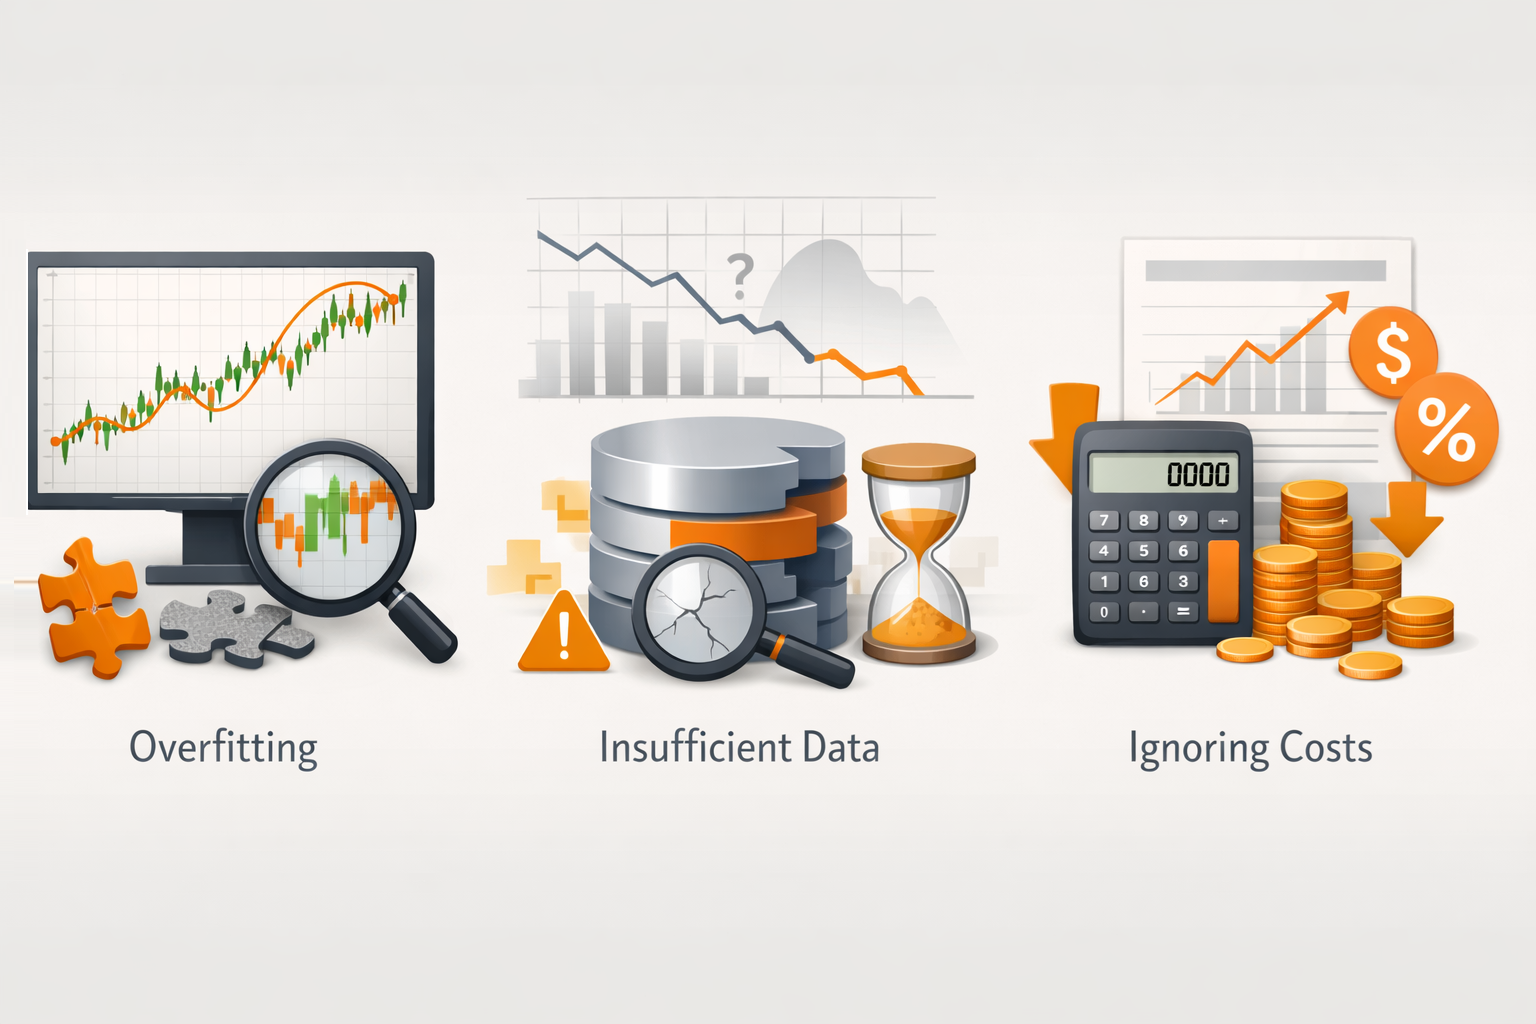
Common Backtesting Mistakes
Many backtests fail to translate to live results because of avoidable errors. Recognizing these mistakes and correcting them is essential for professional-quality work.
- Optimizing on test data—using the same data for parameter tuning and final evaluation inflates results. Always keep a strict out-of-sample set.
- Ignoring transaction costs and slippage—assuming perfect fills at mid prices is unrealistic. Apply commissions, spread, and slippage; if the strategy is marginal after costs, it is not robust.
- Look-ahead bias—using future information (e.g. today’s close for an open entry). Enforce point-in-time logic in every indicator and signal.
- Survivorship bias—testing only on instruments that survived to the present. Use survivorship-bias-free data or include delisted names.
- Trusting a single metric—e.g. total return or win rate alone. Use return, drawdown, Sharpe, win rate, and trade count together.
- Too few trades—results with very few trades are statistically meaningless. Aim for at least 30–50 trades; more for stable metrics.
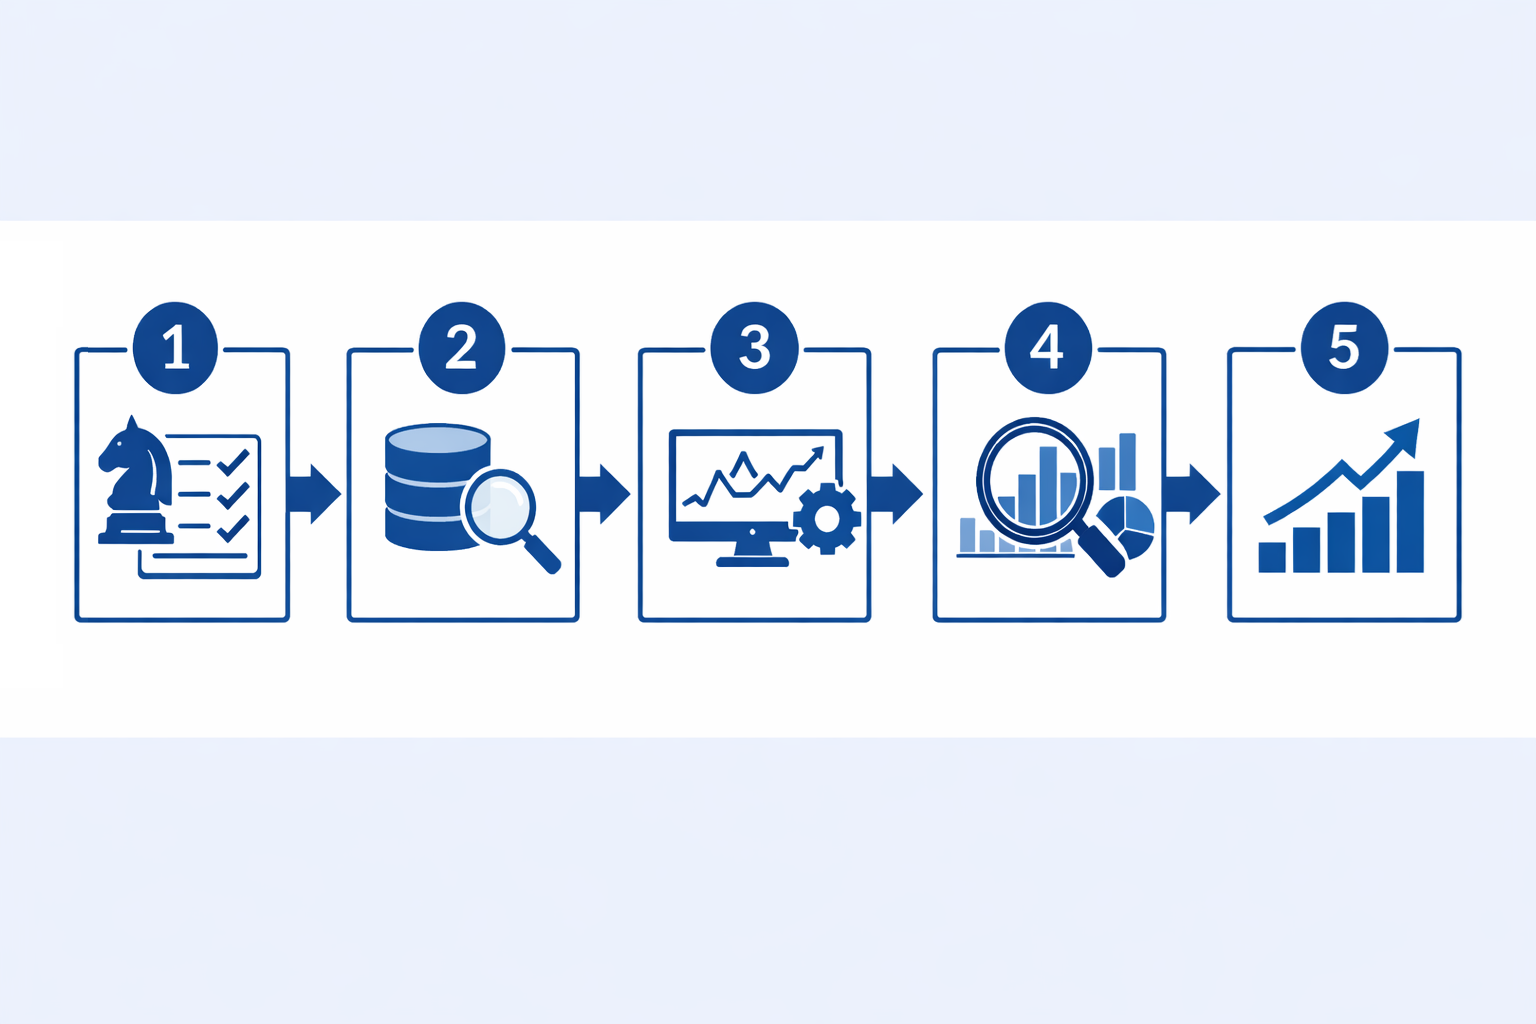
Step-by-Step Backtesting Process
A disciplined process reduces bias and overfitting. A typical professional workflow: (1) Define the strategy—rules, inputs, and execution logic in writing. (2) Source and validate data—quality check, adjust for corporate actions, fix timezone/session. (3) Split data—reserve out-of-sample (e.g. last 20–30%); use the rest for development and optional walk-forward. (4) Implement the backtest—with realistic fills, costs, and slippage. (5) Run walk-forward (if applicable)—roll training and test windows. (6) Evaluate—report metrics on both in-sample and out-of-sample; compare and document limitations.
Validation best practices
- • Keep 20–30% of history as out-of-sample; never optimize or tune on it.
- • Include transaction costs (commission, spread) and realistic slippage in every run.
- • Check robustness across different timeframes, instruments, and market regimes.
- • Document every assumption (data, costs, logic) for reproducibility and audit.
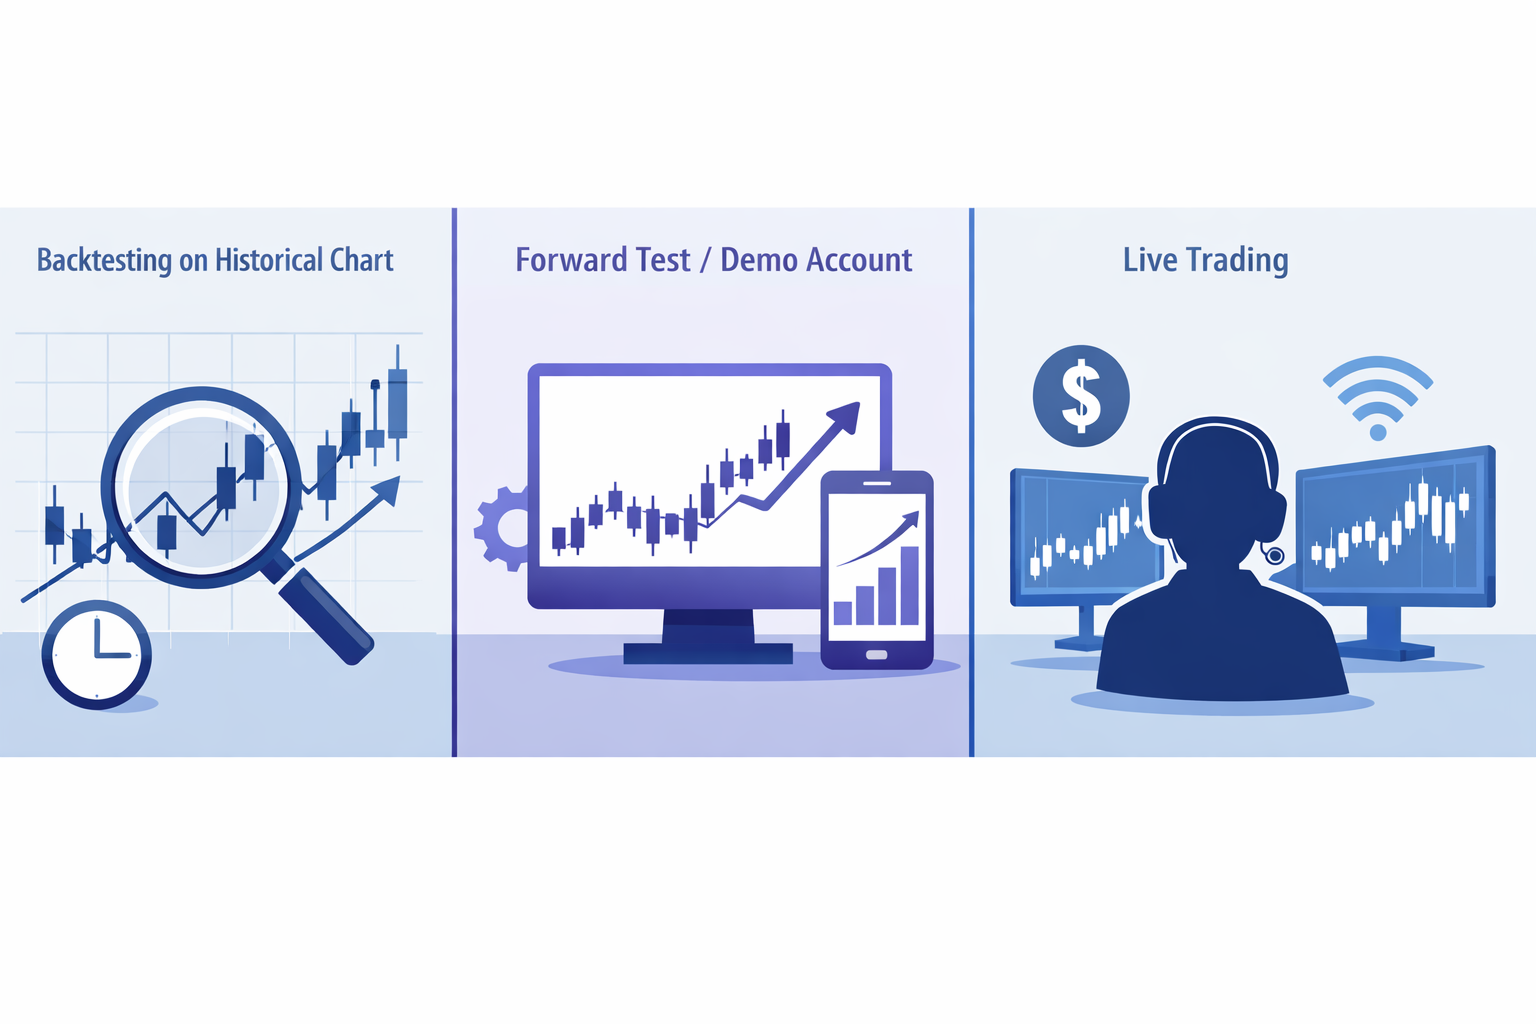
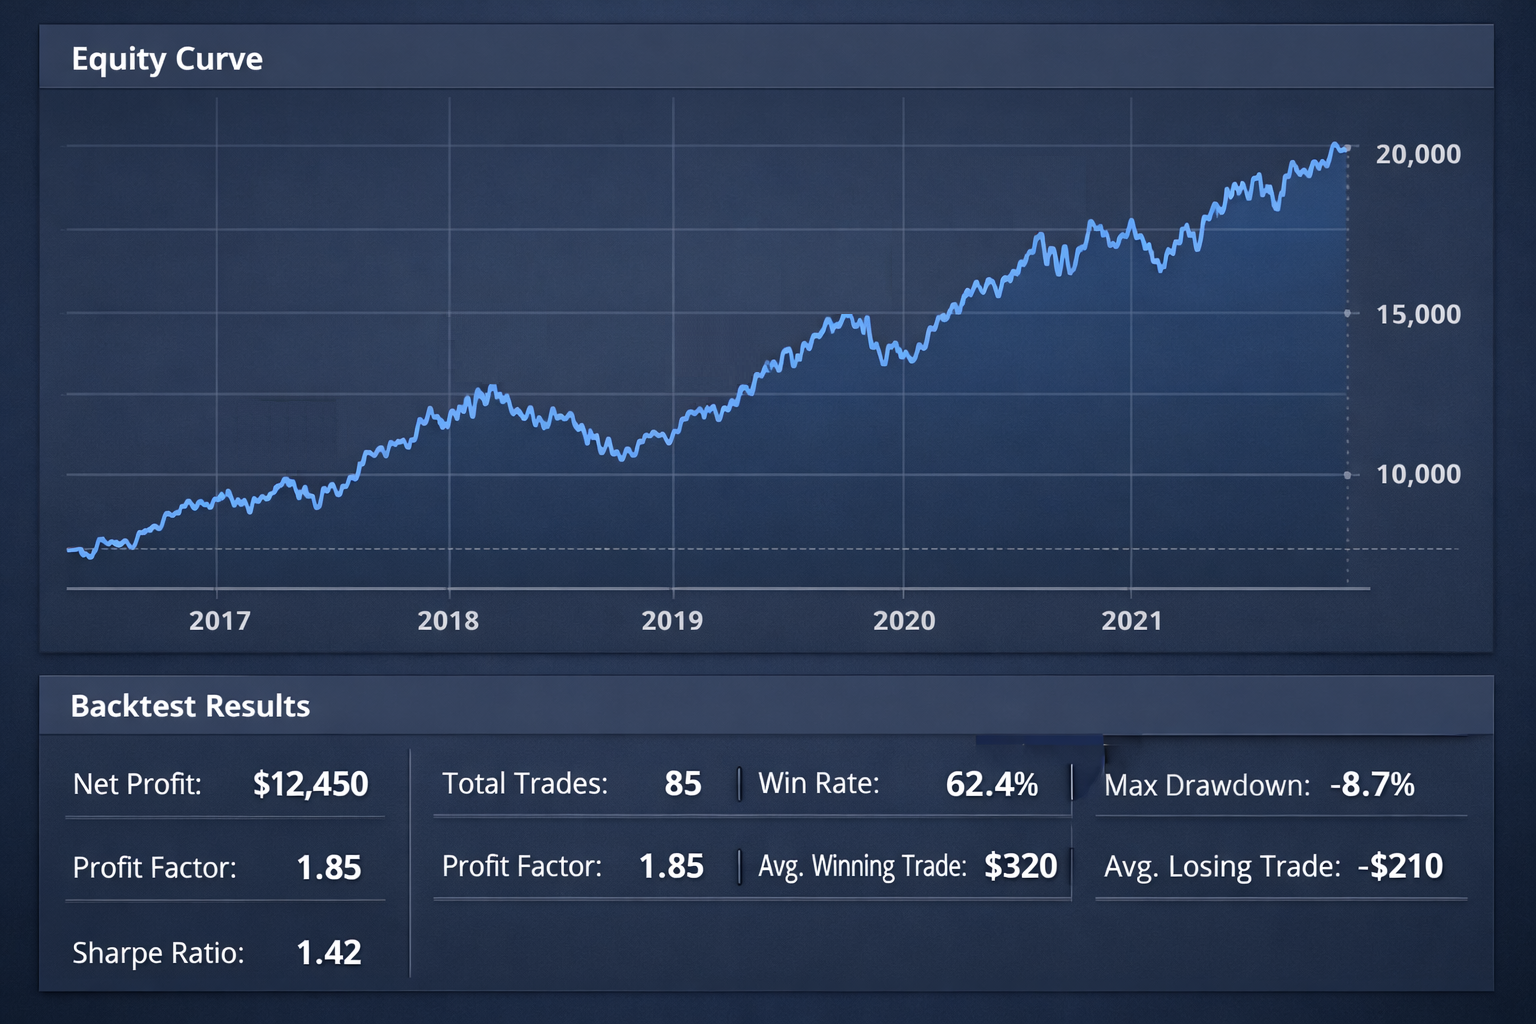
Real-World Backtesting Example
In practice, a strategy might show strong in-sample returns but weaker—or even negative—out-of-sample performance. That is a signal to simplify, reduce parameters, or reject the idea rather than to over-optimize. A real-world workflow: (1) backtest on a long history (e.g. 8–15 years for daily strategies) with clean data and costs; (2) reserve the most recent 20–30% as out-of-sample and report metrics there; (3) run walk-forward if you have enough history; (4) paper-trade for at least one to three months and compare to backtest expectations; (5) only then consider live deployment with small size. This sequence reduces surprises and builds confidence in the process.
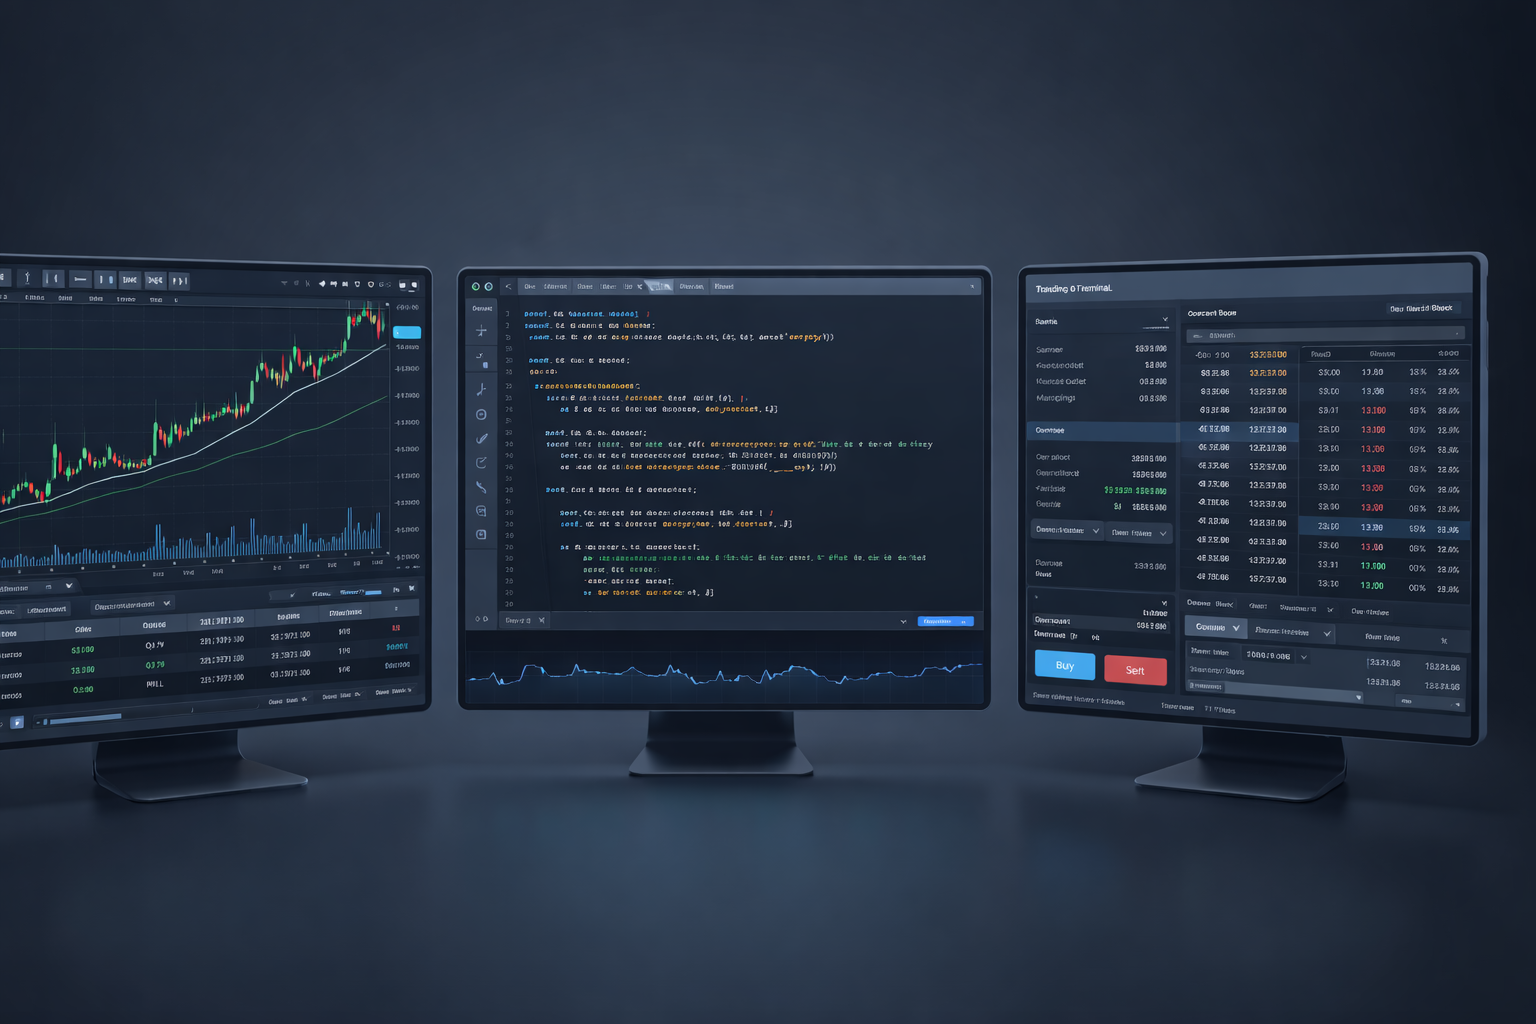
Software Tools & 2026 Best Practices
In 2026, professional backtesting continues to rely on clean data, conservative execution assumptions, and strict validation. Choose tools that support custom data, realistic order execution (slippage, partial fills, latency where relevant), and walk-forward or out-of-sample testing. Platforms such as QuantConnect, Backtrader, Zipline, MetaTrader Strategy Tester, and TradingView are widely used; the best choice depends on your asset class, data needs, and programming preference.
Core best practices: source and document your data; include commissions, spread, and slippage in every run; use a fixed out-of-sample period and walk-forward where appropriate; report a full set of metrics (return, drawdown, Sharpe, win rate, profit factor, trade count); prefer strategies that hold up across multiple markets and regimes over those that maximize in-sample return.
- Source quality data and document adjustments and filters
- Include commissions, spread, and slippage in every backtest run
- Use walk-forward and a fixed out-of-sample period; never optimize on OOS
- Prefer robustness and consistency over peak in-sample performance
- Paper-trade after backtest and out-of-sample validation before going live
Professional FAQs
Below are answers to the most common professional questions about backtesting trading strategies, data, metrics, overfitting, validation, and best practices for 2026.
Why did my backtest perform well but live trading fail?
The most common causes are (1) overfitting—parameters tuned to historical noise that do not generalize; (2) look-ahead bias—using information that would not have been available at trade time; (3) optimistic execution—assuming fills at exact prices with no slippage or spread; (4) survivorship or selection bias in the data; (5) regime change—markets behaving differently than in the test period. Fix by using walk-forward or out-of-sample validation, including realistic costs and slippage, and avoiding optimization on the test set.
How much historical data should I use for backtesting?
Use enough data to cover multiple market regimes (bull, bear, sideways, high/low volatility) and at least several full cycles. For daily or swing strategies, 8–15+ years is common; for intraday, 2–5 years of minute or tick data is often used. More data generally improves statistical significance but ensure the data is clean and that very old data still reflects tradeable conditions (e.g. liquidity, instruments).
What is a good Sharpe ratio in backtesting?
After deducting realistic transaction costs and slippage, an annualized Sharpe ratio above 1.0 is considered solid for many asset classes; above 1.5 is strong. Be skeptical of backtest Sharpes above 2.0—they often indicate overfitting, look-ahead bias, or unrealistic execution. Compare in-sample vs out-of-sample Sharpe; large degradation suggests overfitting.
What is look-ahead bias and how do I avoid it?
Look-ahead bias occurs when your strategy uses information that would not have been available at the time of the trade (e.g. using today’s close to decide an entry at today’s open, or using revised earnings). Avoid it by (1) aligning every signal and indicator to the bar’s open or prior close; (2) using point-in-time data for fundamentals; (3) ensuring no future data leaks in feature engineering; (4) reviewing order of operations in your backtest engine.
What is survivorship bias and why does it matter?
Survivorship bias means testing only on instruments that still exist today, excluding those that were delisted, merged, or went bankrupt. Results then overstate returns because losers are omitted. For equity backtests, use a survivorship-bias-free dataset or explicitly include delisted names. For indices or ETFs, understand whether the index itself is survivorship-biased.
How do I include transaction costs and slippage in a backtest?
Apply (1) commission per trade or per share; (2) spread (half-spread per side for a round trip); (3) slippage—often modeled as a fixed basis-point or tick cost, or as a function of volume/volatility. For forex, 0.5–2 pips slippage per side is common; for equities, 1–5 bps. Use conservative estimates; if the strategy is marginal after costs, it is not robust.
What is walk-forward analysis and when should I use it?
Walk-forward analysis repeatedly trains the strategy on a rolling in-sample window and tests on the following out-of-sample window, then rolls forward. It mimics how you would re-optimize in practice and reduces overfitting. Use it when you have enough history to split into multiple train/test periods (e.g. train on 3 years, test on 1 year, roll by 1 year).
What is the difference between in-sample and out-of-sample testing?
In-sample (IS) is the data used to develop or optimize the strategy; out-of-sample (OOS) is data held back and never used for optimization—only for final evaluation. Performance on OOS is a better indicator of future live performance. Always reserve 20–30% of history as OOS and never tune parameters based on OOS results.
How many trades do I need for a statistically significant backtest?
There is no single number, but more trades improve confidence. Rough guidelines: at least 30–50 trades for basic inference; 100+ for more stable metrics (e.g. Sharpe); 500+ for tail risk (e.g. max drawdown). Use Monte Carlo simulation or confidence intervals on key metrics to assess statistical significance.
What is curve-fitting and how is it different from overfitting?
Curve-fitting is tuning a model (e.g. strategy parameters) so closely to historical data that it fits noise rather than signal; it is a form of overfitting. The result looks excellent in-sample but fails out-of-sample. Mitigate by using fewer parameters, simpler rules, walk-forward validation, and by preferring strategies that work across multiple markets and periods.
Should I backtest on one asset or multiple?
Testing on multiple assets or markets improves confidence that the strategy captures a real edge rather than asset-specific noise. If a strategy only works on one symbol or one period, treat it as fragile. Multi-asset or multi-market robustness is a key professional standard.
What is Monte Carlo simulation in backtesting?
Monte Carlo simulation randomizes the order of trades (or applies other randomness) to generate many possible equity curves from the same set of trades. It helps estimate the distribution of outcomes (e.g. drawdown, final return) and the probability of ruin. Use it to stress-test strategy robustness beyond a single historical path.
How do I handle corporate actions (splits, dividends) in backtest data?
Use adjusted OHLC data where prices are restated for splits and dividends so that historical charts are consistent. For total-return backtests, reinvest dividends in the security or cash. Ensure your data provider’ adjustment method matches your strategy (e.g. price return vs total return).
What backtesting software or platforms do professionals use?
Professionals use platforms that support realistic execution (slippage, costs), walk-forward analysis, and multi-asset testing. Examples include QuantConnect, Backtrader, Zipline, MetaTrader Strategy Tester, TradingView, and proprietary in-house systems. Choose one that allows full control over data, execution assumptions, and metrics.
Can I trust a backtest that has a very high win rate?
High win rate alone is not sufficient; it can mask poor risk-reward (e.g. many small wins, few large losses). Always look at profit factor, expectancy, max drawdown, and Sharpe together. Be suspicious of win rates above 70–80% on liquid markets—they may indicate overfitting or unrealistic execution.
What is regime change and how does it affect backtests?
Regime change is when market behavior shifts (e.g. from trending to ranging, or volatility expanding). A strategy optimized for one regime may fail in another. Improve robustness by testing across different periods and markets, using regime detection, or by designing strategies that adapt or perform acceptably in multiple regimes.
When should I use paper trading after a backtest?
Use paper trading (or a small live allocation) after the backtest and out-of-sample validation look solid. Paper trading checks execution, data feed, and psychological discipline in real time. Run it for at least one to three months and compare results to backtest expectations before scaling up.
What is the best way to report backtest results professionally?
Report key metrics (total return, annualized return, max drawdown, Sharpe, Sortino, win rate, profit factor, number of trades), over both in-sample and out-of-sample periods. State data range, costs and slippage assumptions, and any limitations. Use tables and equity curves; avoid cherry-picking periods or metrics.
Getting Started Checklist
Before going live, ensure you have: quality, documented data; realistic costs and slippage in the backtest; a full set of metrics (return, drawdown, Sharpe, win rate, profit factor, trade count); walk-forward or a fixed out-of-sample validation with no optimization on the test period; and preferably paper trading results that align with backtest expectations.
Summary: Professional Backtesting in 2026
- Data quality and point-in-time logic are the foundation of reliable backtests; document sources and adjustments.
- Avoid overfitting with fewer parameters, walk-forward analysis, and strict out-of-sample testing.
- Use return, drawdown, Sharpe, win rate, and trade count together; never rely on a single metric.
- Include transaction costs and slippage in every backtest; prefer robustness over peak in-sample performance.
- Paper-trade after validation and compare to backtest before scaling live.