What is Price Action Trading?
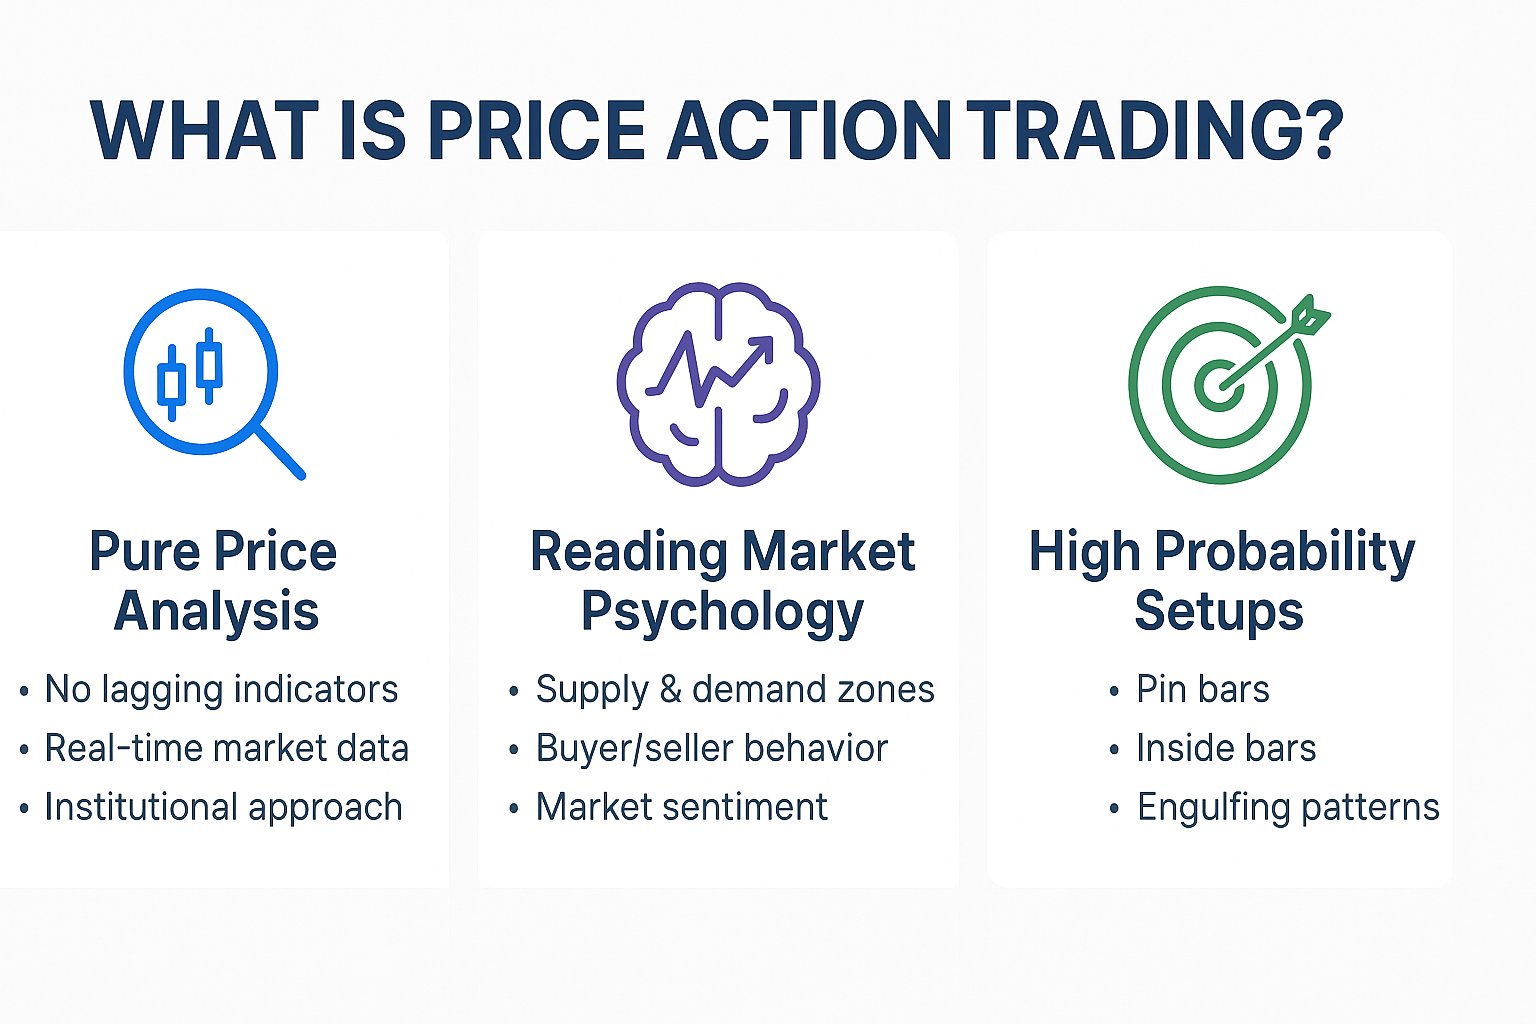
Price Action Trading is a methodology that analyzes raw price movements on charts without relying on lagging technical indicators. It focuses on reading candlestick patterns, support/resistance levels, and market structure to make trading decisions.
Unlike traditional technical analysis that uses moving averages, oscillators, or other indicators, price action trading interprets what the market is actually doing in real-time. Traders read the "footprints" left by buyers and sellers to predict future price movements.
Professional traders and institutions primarily use price action because it provides unfiltered market information. When you remove lagging indicators, you see price movement in its purest form - exactly what large players are doing.
Why Trade Price Action?
No Lagging Indicators
Price action responds instantly to market changes. No waiting for indicators to catch up or give false signals during ranging markets.
Pure Market Psychology
Read the battle between buyers and sellers directly. Understand who is in control and when sentiment is shifting.
Works on All Timeframes
Scalpers, day traders, and swing traders all use price action. Patterns work the same on 5-minute or daily charts.
Clear Risk Management
Price action setups have clear entry points, stop losses, and targets. No guessing where to place your stops.
Essential Candlestick Patterns
Candlestick patterns are the foundation of price action trading. Each candle tells a story about the battle between buyers and sellers during that time period. Understanding these patterns is crucial for identifying high-probability trading opportunities.
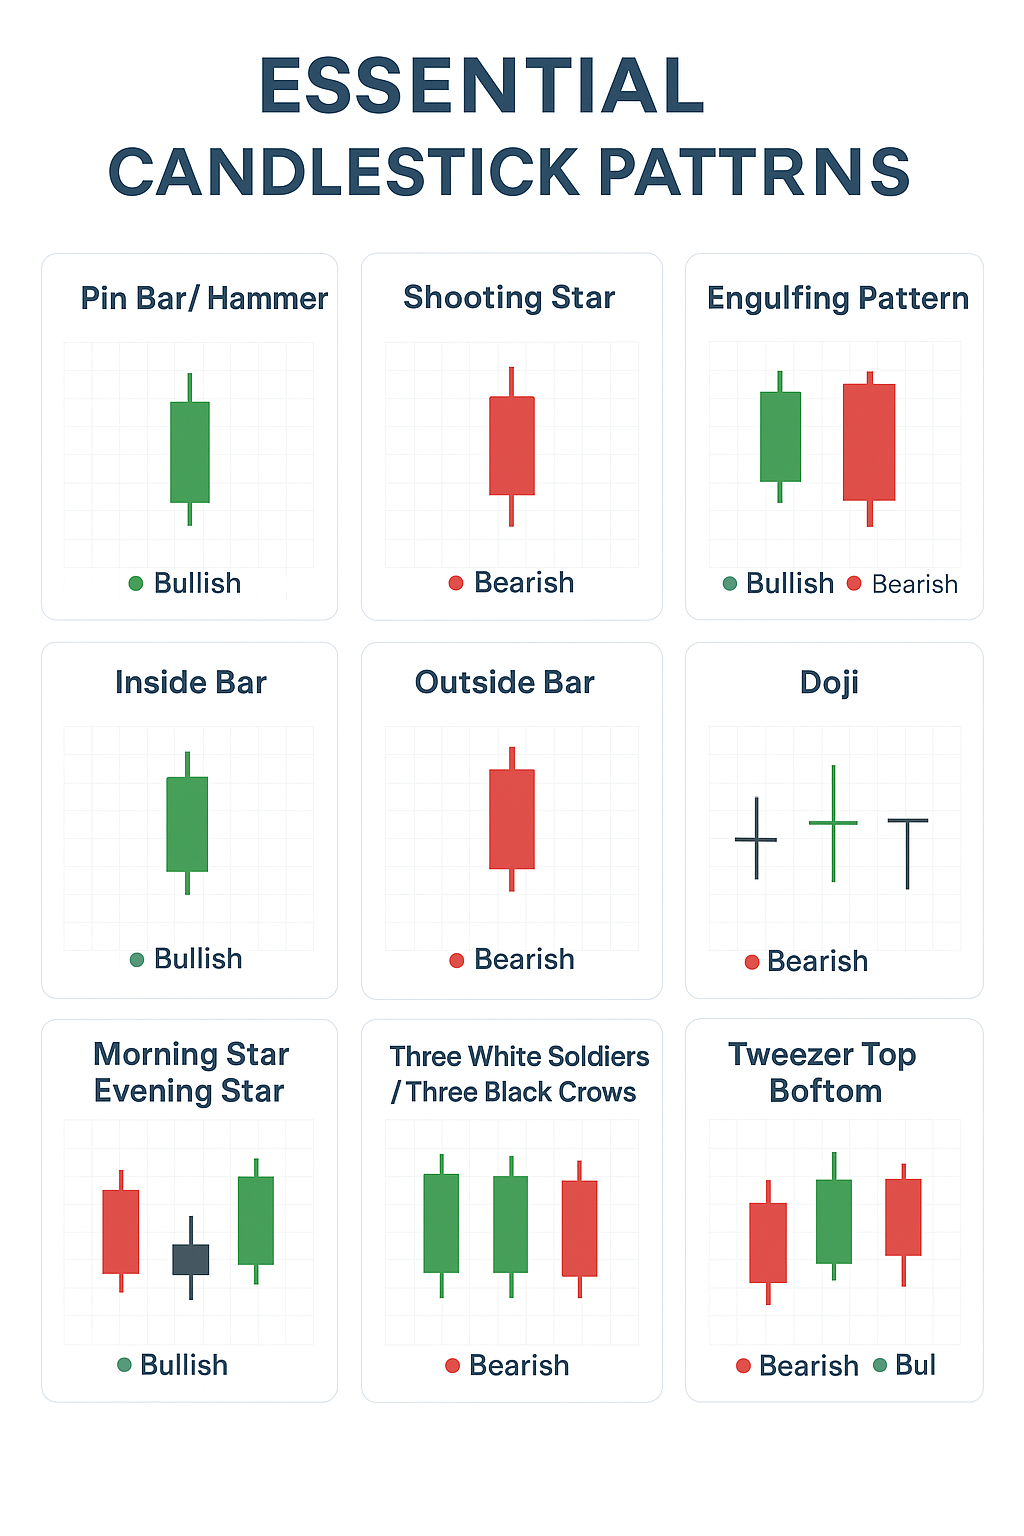
Pin Bar (Hammer/Shooting Star)
The pin bar is one of the most powerful reversal patterns. It shows strong rejection of a price level.
- • Long wick: Shows rejection (2-3x body size)
- • Small body: Indicates indecision resolved in one direction
- • Little/no opposite wick: Confirms strong directional bias
- • Best at key levels: Support/resistance makes pattern most reliable
Inside Bar
Inside bars represent consolidation and often precede explosive breakouts.
- • Mother bar: The larger preceding candle sets the range
- • Inside bar: Completely within mother bar high/low
- • Breakout entry: Trade the break of mother bar high or low
- • Stop placement: Beyond the opposite side of mother bar
Engulfing Pattern
Engulfing patterns show a dramatic shift in momentum and sentiment.
- • Bullish engulfing: Large green candle engulfs previous red candle
- • Bearish engulfing: Large red candle engulfs previous green candle
- • Complete engulfing: Body must completely cover previous candle body
- • Context matters: Most powerful at support/resistance levels
Doji Patterns
Doji candles show indecision and potential reversals when at key levels.
- • Regular doji: Open and close nearly equal
- • Dragonfly doji: Long lower wick, bullish at support
- • Gravestone doji: Long upper wick, bearish at resistance
- • Confirmation needed: Wait for next candle direction
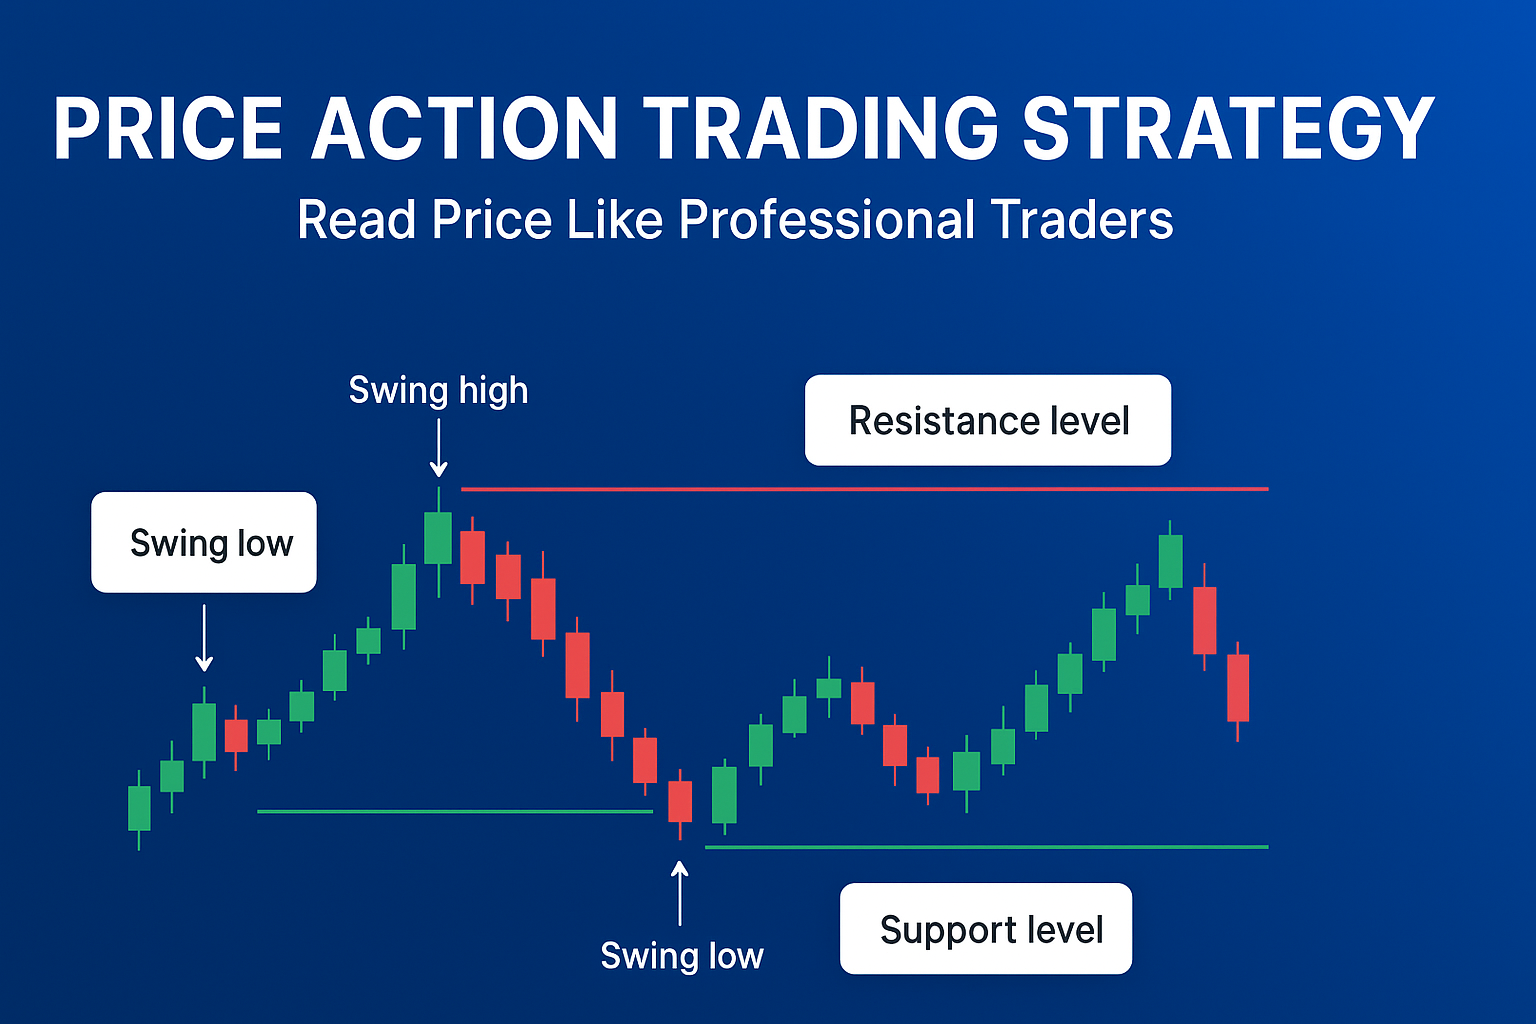
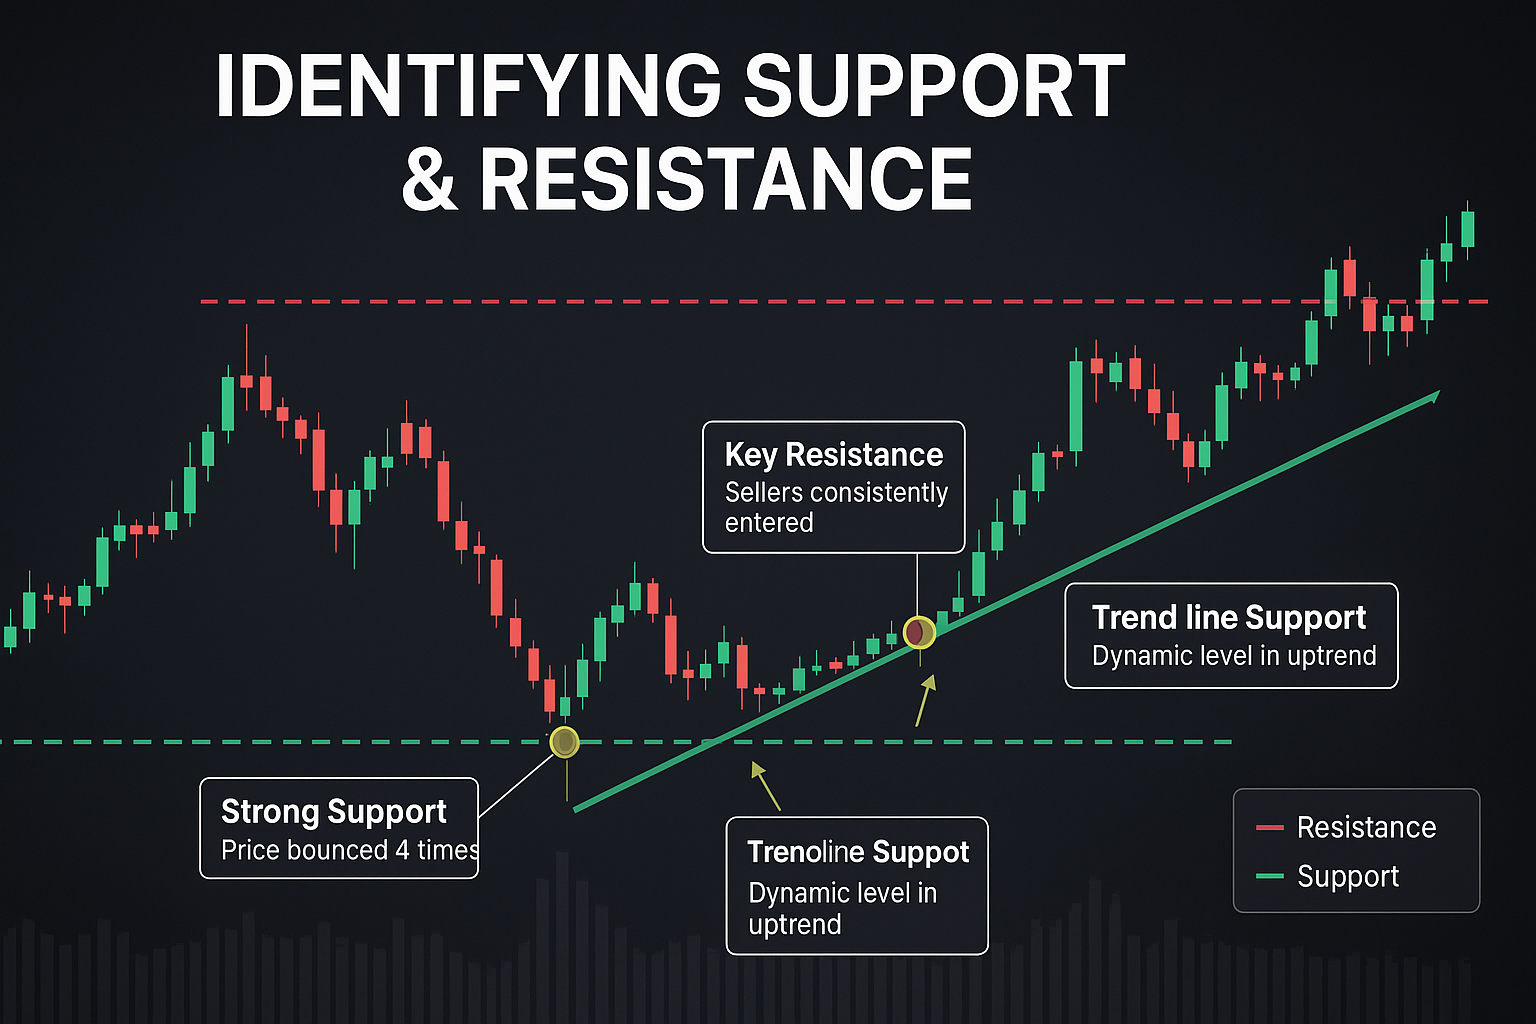
Support & Resistance Levels
Support and resistance levels are where price action patterns have the highest probability of success. These levels represent psychological price zones where buyers and sellers have historically shown strong interest.
Support Levels
- Definition: Price level where buying pressure overcomes selling pressure
- Identification: Multiple bounces from same horizontal level
- Trading: Look for bullish reversal patterns at support
- Broken support: Becomes resistance (role reversal)
Resistance Levels
- Definition: Price level where selling pressure overcomes buying pressure
- Identification: Multiple rejections from same horizontal level
- Trading: Look for bearish reversal patterns at resistance
- Broken resistance: Becomes support (role reversal)
Key Level Trading Rules
- • The more times a level is tested, the stronger it becomes
- • Look for confluence: multiple levels, Fibonacci, round numbers
- • Daily and weekly levels are stronger than intraday levels
- • Wait for confirmation pattern before entering at levels
- • When level breaks, expect retest from opposite side (role reversal)
Market Structure & Trends
Understanding market structure is fundamental to price action trading. Markets move in trends and ranges, creating higher highs/lows or lower highs/lows. Trading with market structure dramatically improves your edge.
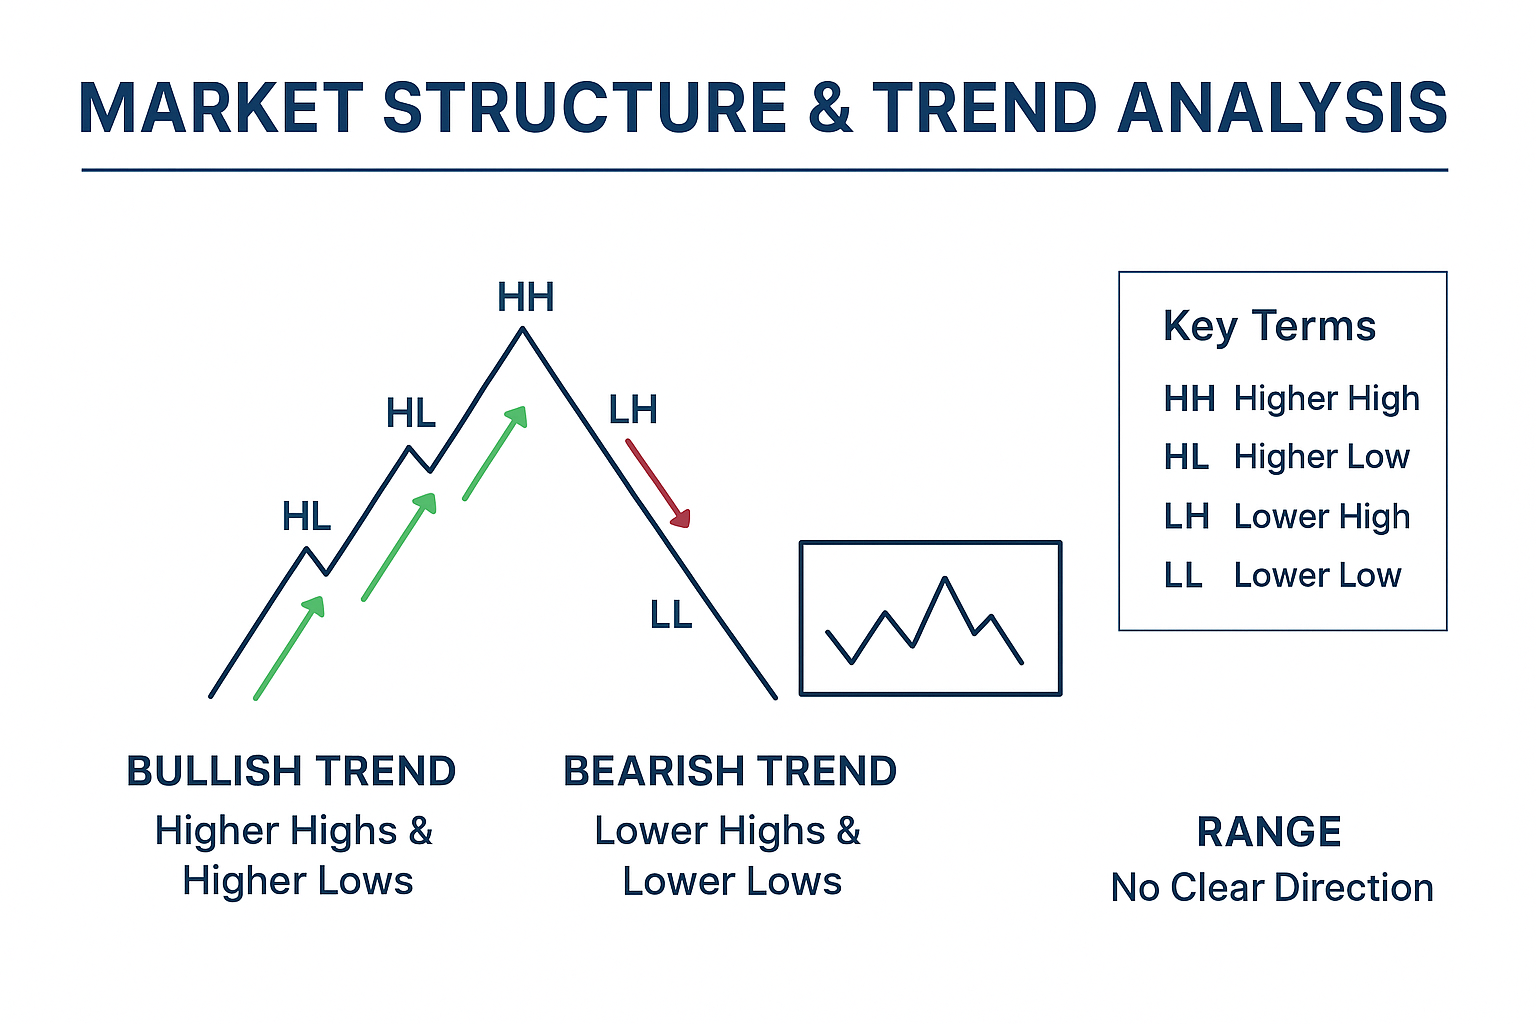
Uptrend Structure
Definition: Series of higher highs (HH) and higher lows (HL). Each rally exceeds the previous high, and each pullback finds support above the previous low.
Trading Rules:
- • Buy pullbacks to support/Fibonacci levels
- • Look for bullish reversal patterns at higher lows
- • Avoid shorting in strong uptrends
- • Trend ends when price makes lower low
Downtrend Structure
Definition: Series of lower highs (LH) and lower lows (LL). Each decline exceeds the previous low, and each rally finds resistance below the previous high.
Trading Rules:
- • Sell rallies to resistance/Fibonacci levels
- • Look for bearish reversal patterns at lower highs
- • Avoid buying in strong downtrends
- • Trend ends when price makes higher high
Range/Consolidation
Definition: Price moves sideways between defined support and resistance. No clear higher highs/lows or lower highs/lows.
Trading Rules:
- • Buy at support, sell at resistance
- • Look for breakout patterns (inside bars)
- • Reduce position size (choppier moves)
- • Prepare for breakout in either direction
Pin Bar Reversal Strategy
The pin bar is the most reliable price action pattern for catching reversals at key levels. It shows powerful rejection of a price zone and indicates strong directional intent.
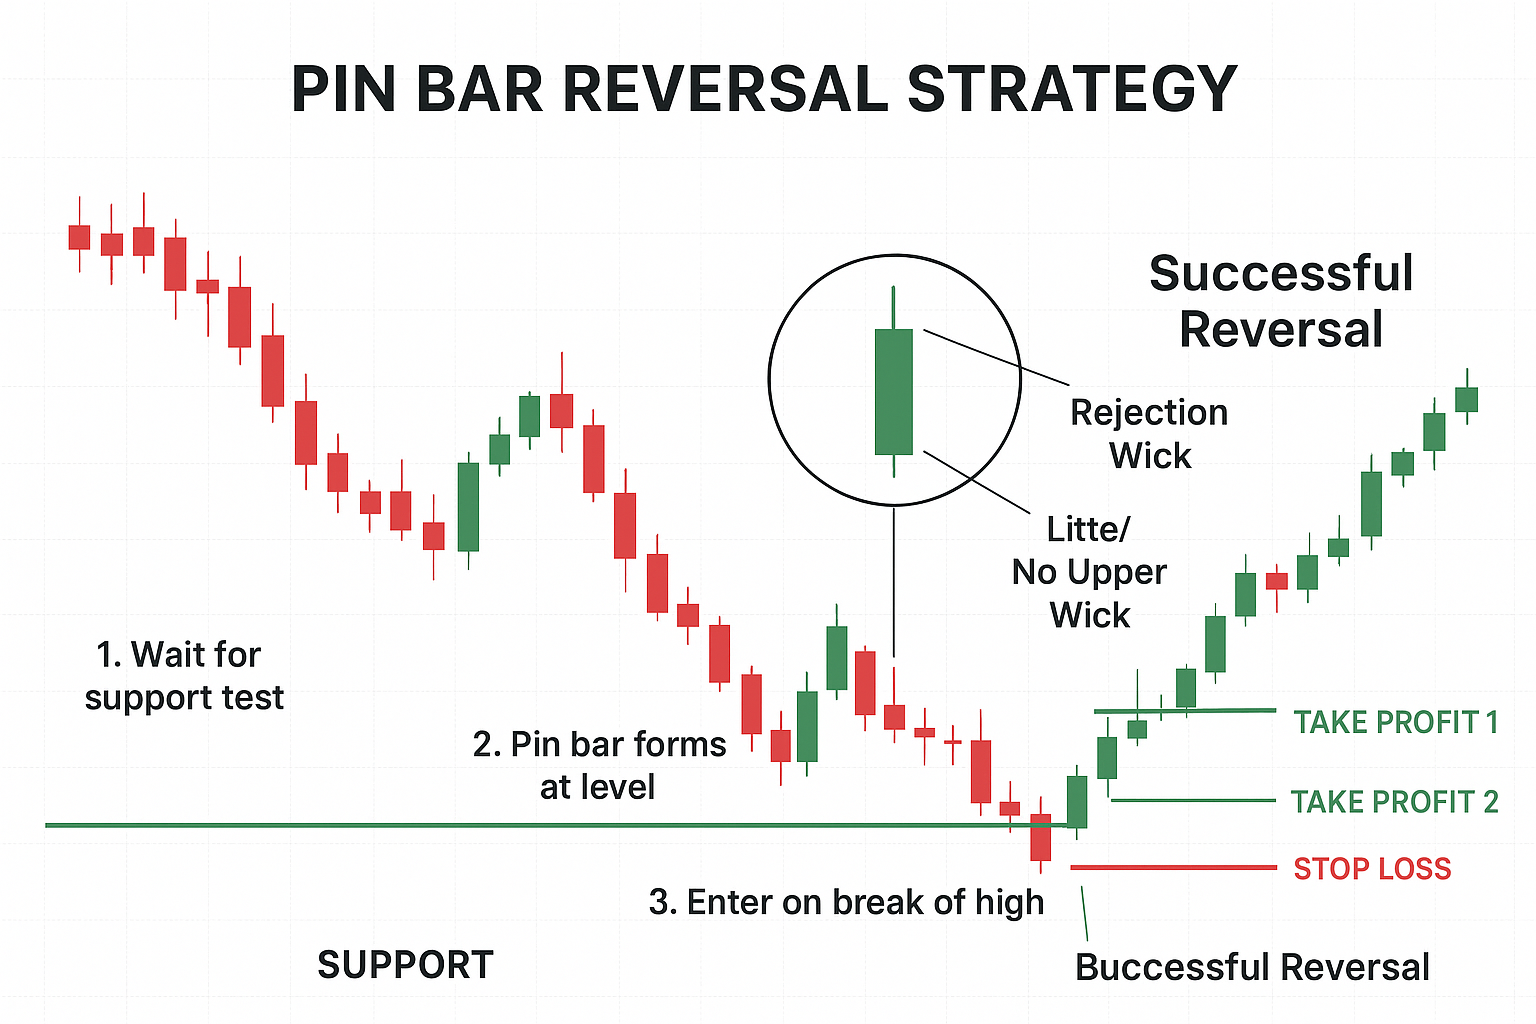
Perfect Pin Bar Requirements
1. Wick Size
The rejection wick must be 2-3 times longer than the candle body. This shows strong rejection of the price level.
2. Body Position
For bullish pin bar, body should be in upper third. For bearish, body in lower third. Shows direction of resolved pressure.
3. Opposite Wick
Little or no wick on opposite side. Bullish pin bar should have no upper wick. Bearish should have no lower wick.
4. Location
Must occur at key support/resistance, Fibonacci level, or supply/demand zone. Random pin bars have low probability.
Pin Bar Entry Method:
- Entry: Place order 1-2 pips above pin bar high (bullish) or below low (bearish)
- Stop Loss: 2-5 pips beyond opposite end of pin bar
- Target 1: Recent swing high/low (minimum 1:2 risk-reward)
- Target 2: Next major level (1:3 or better risk-reward)
- Management: Move stop to breakeven when price moves 1R in profit
Inside Bar Breakout Strategy
Inside bars represent market consolidation and indecision. When they occur at key levels or during strong trends, their breakouts often lead to explosive moves.
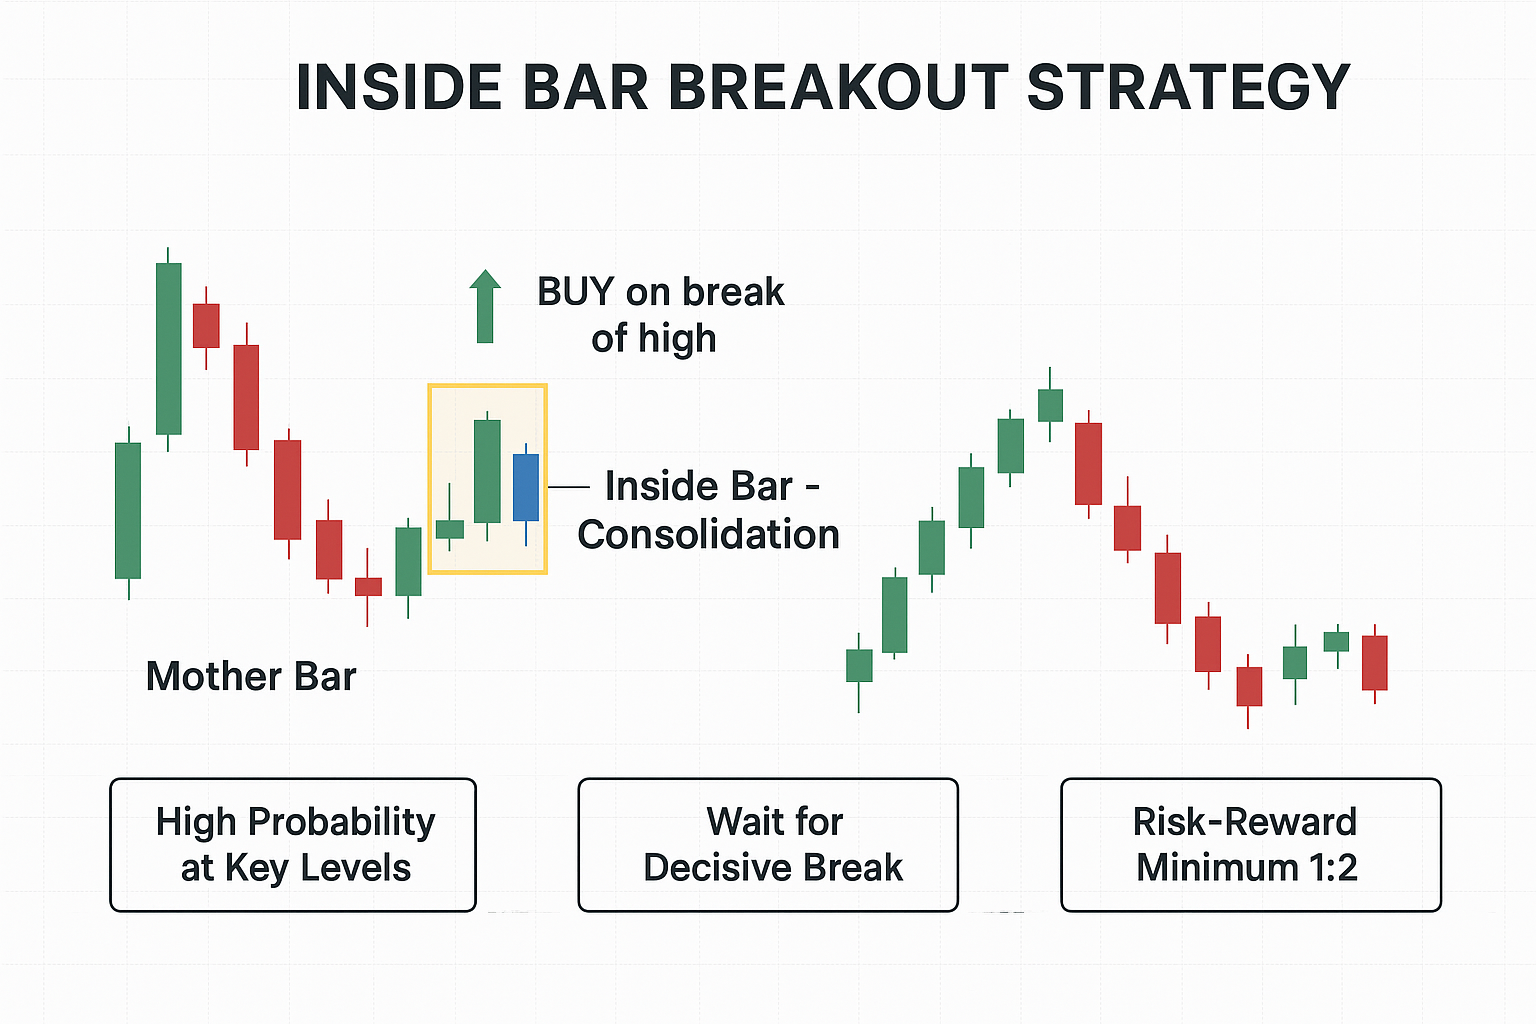
Inside Bar Trading Setup
Bullish Breakout
- • Entry: 2-5 pips above mother bar high
- • Stop: Below mother bar low
- • Target: Next resistance level
- • Best in uptrends at support
Bearish Breakout
- • Entry: 2-5 pips below mother bar low
- • Stop: Above mother bar high
- • Target: Next support level
- • Best in downtrends at resistance
Engulfing Pattern Strategy
Engulfing patterns are powerful reversal signals that show a dramatic shift in market sentiment. They indicate that one side has completely overwhelmed the other.
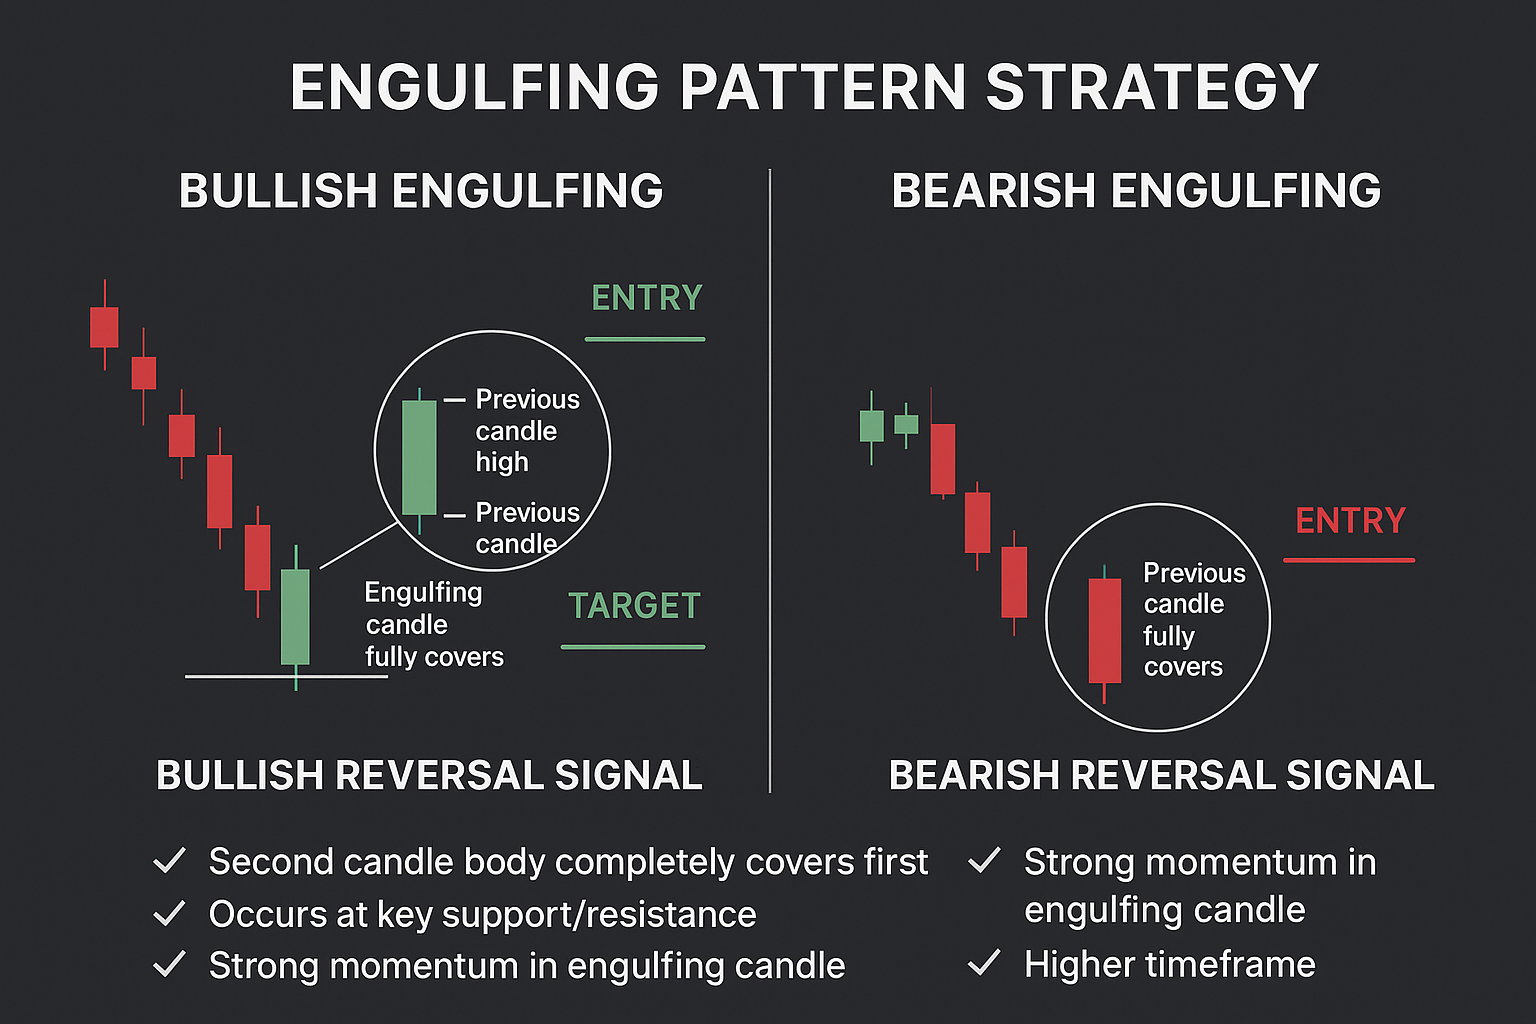
Bullish Engulfing
- • Large green candle completely covers previous red candle
- • Shows buyers overwhelming sellers
- • Most powerful at support levels
- • Enter on close or next candle open
- • Stop below engulfing candle low
Bearish Engulfing
- • Large red candle completely covers previous green candle
- • Shows sellers overwhelming buyers
- • Most powerful at resistance levels
- • Enter on close or next candle open
- • Stop above engulfing candle high
Fibonacci Retracement in Price Action
Fibonacci retracement levels provide precise entry zones for price action traders. When combined with reversal patterns at Fib levels, probability of success increases dramatically.
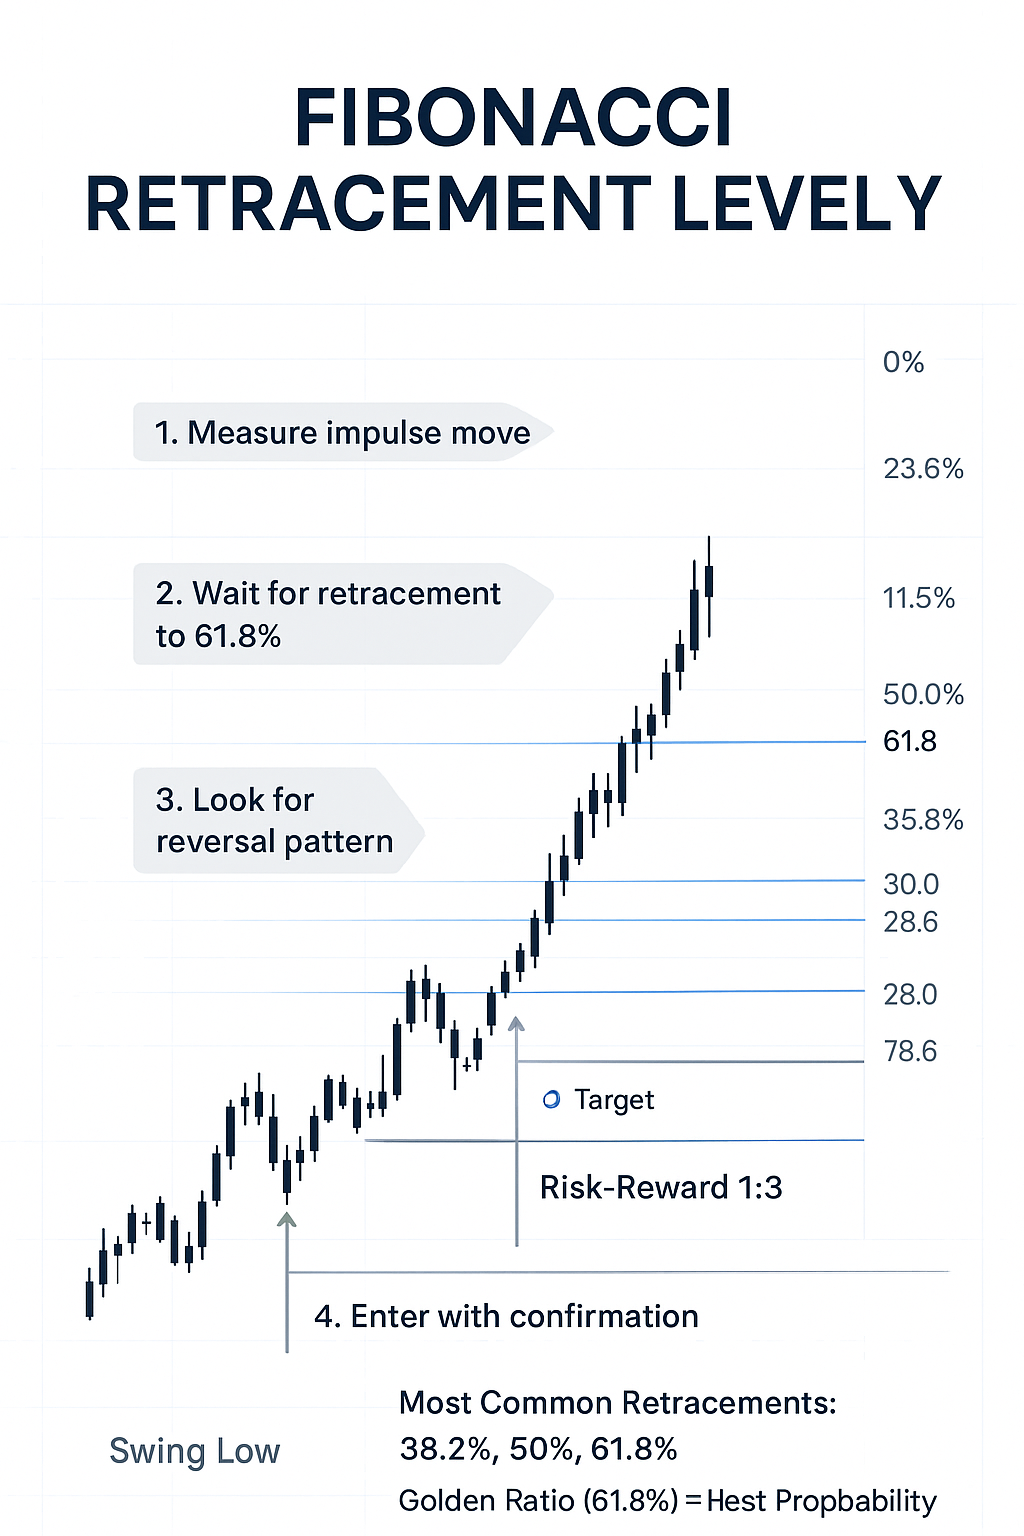
Key Fibonacci Levels
Multiple Timeframe Analysis
Professional traders always check multiple timeframes before entering a trade. This top-down approach ensures you're trading with the bigger picture and avoiding counter-trend setups.
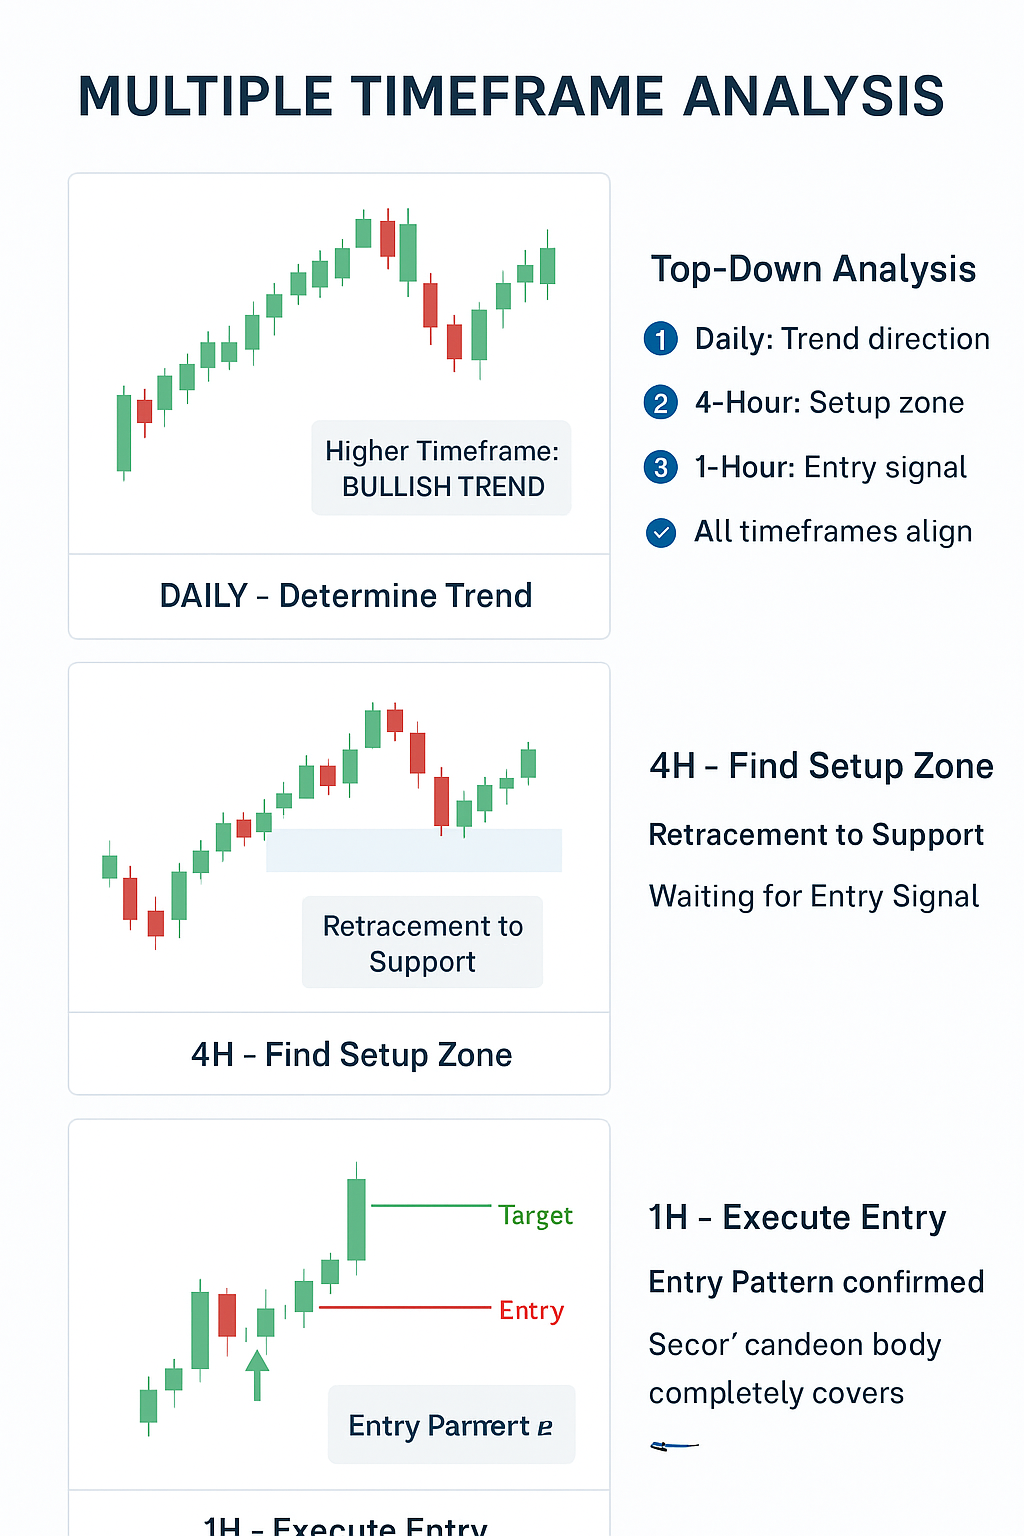
Top-Down Analysis Method
Step 1: Higher Timeframe (Daily/Weekly)
Identify overall trend direction. Mark major support/resistance levels. Determine market structure (trending or ranging).
Step 2: Intermediate Timeframe (4H/1H)
Find pullback or setup zones. Identify where price might reverse or continue. Look for key levels within the trend.
Step 3: Entry Timeframe (15M/5M)
Wait for price action confirmation pattern. Execute entry with precise stop loss. Manage trade according to plan.
Price Action Entry Checklist
Before entering any trade, ensure all criteria are met. This checklist dramatically improves your win rate by filtering out low-probability setups.
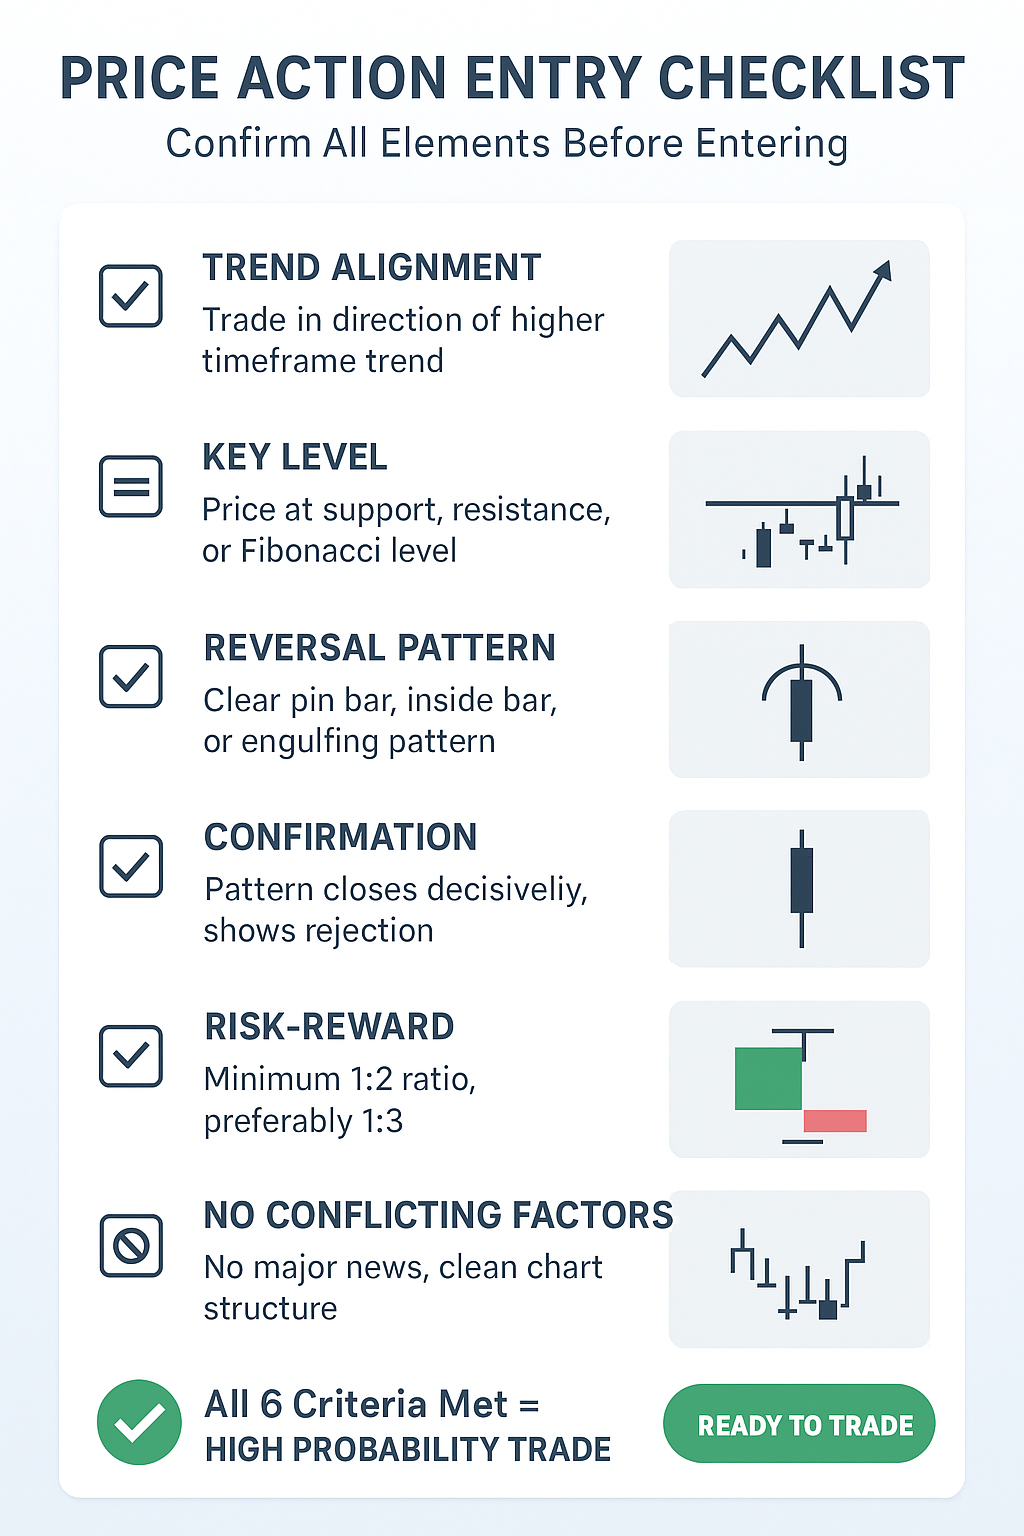
High-Probability Setup Criteria
1. Trend Alignment
Higher timeframe trend must align with your trade direction. Never fight the daily trend on lower timeframes.
2. Key Level Present
Price must be at support, resistance, Fibonacci level, or supply/demand zone. No random entries.
3. Clear Reversal Pattern
Pin bar, inside bar, or engulfing pattern must be textbook quality. No mediocre patterns.
4. Strong Confirmation
Pattern must close decisively. Long wicks show rejection. Body position indicates resolved direction.
5. Favorable Risk-Reward
Minimum 1:2 risk-reward ratio. Ideally 1:3 or better. If R:R isn't favorable, skip the trade.
6. No Conflicting Factors
Avoid high-impact news times. No opposite patterns on higher timeframes. Clean chart structure.
False Breakouts & Stop Hunts
False breakouts trap retail traders while smart money accumulates positions. Learning to identify and avoid these traps is crucial for long-term success.
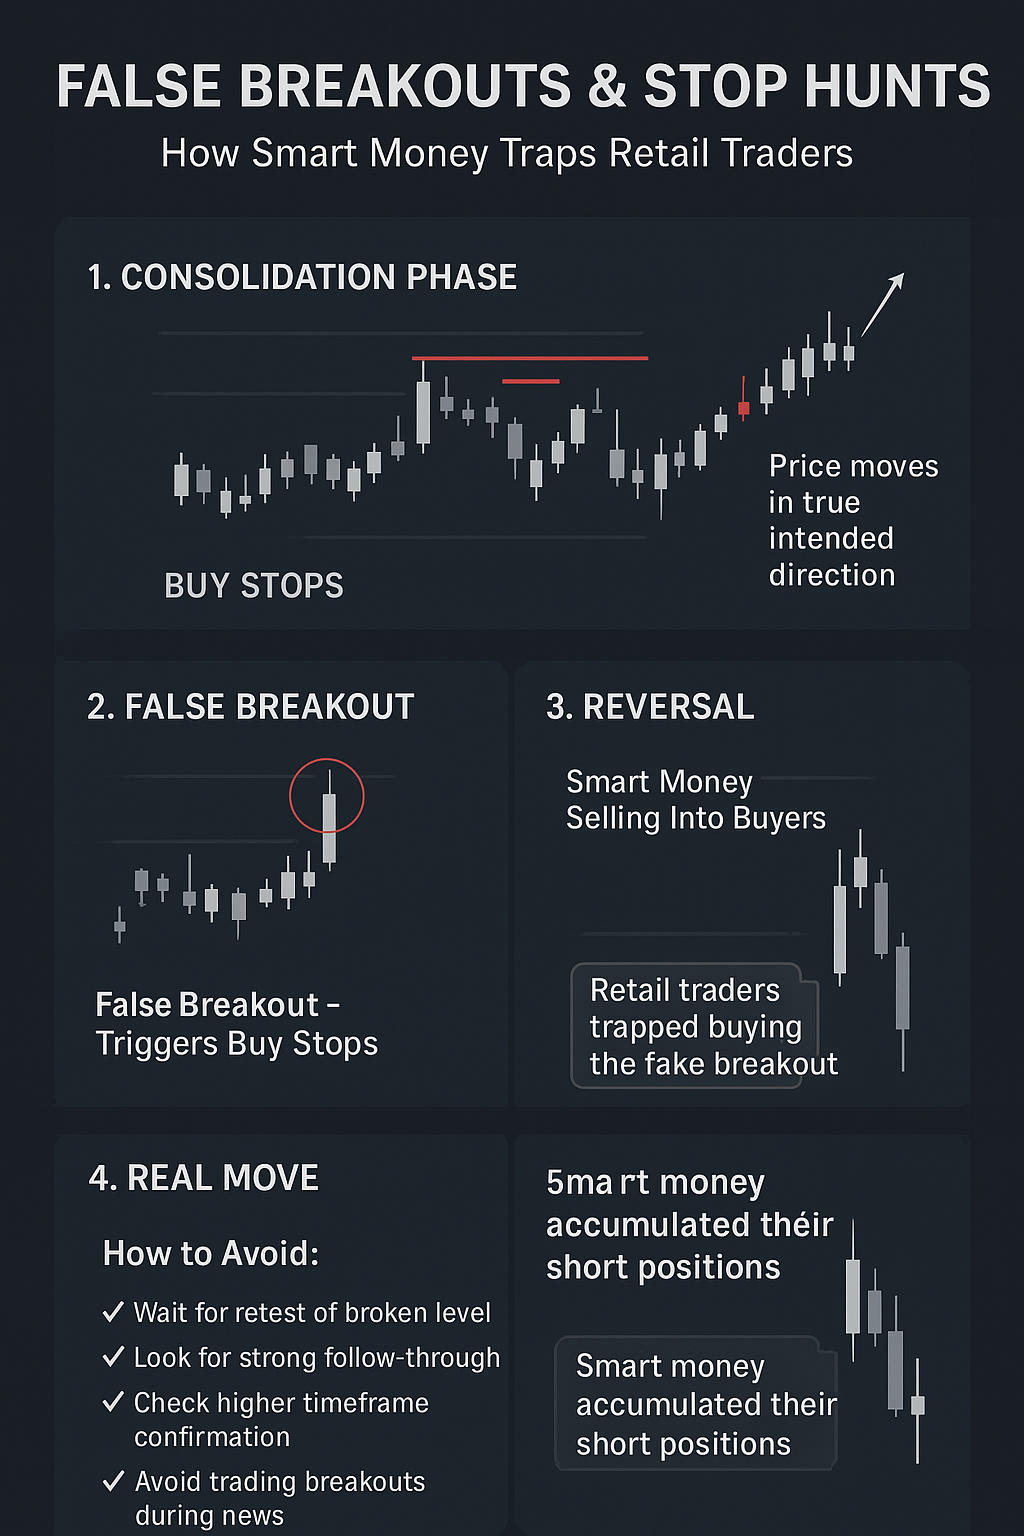
How to Avoid False Breakouts
- • Wait for retest: Let price break level, then wait for pullback to test broken level
- • Look for follow-through: Multiple candles closing beyond level confirms true break
- • Check higher timeframe: Ensure breakout aligns with bigger picture
- • Avoid news times: Major news creates false breakouts
- • Watch for wicks: Long wicks back into range = failed breakout
- • Volume confirmation: True breakouts often show increased volume
Supply & Demand Zones
Supply and demand zones are superior to simple support/resistance lines. They represent areas where institutional orders sit, waiting to be filled.
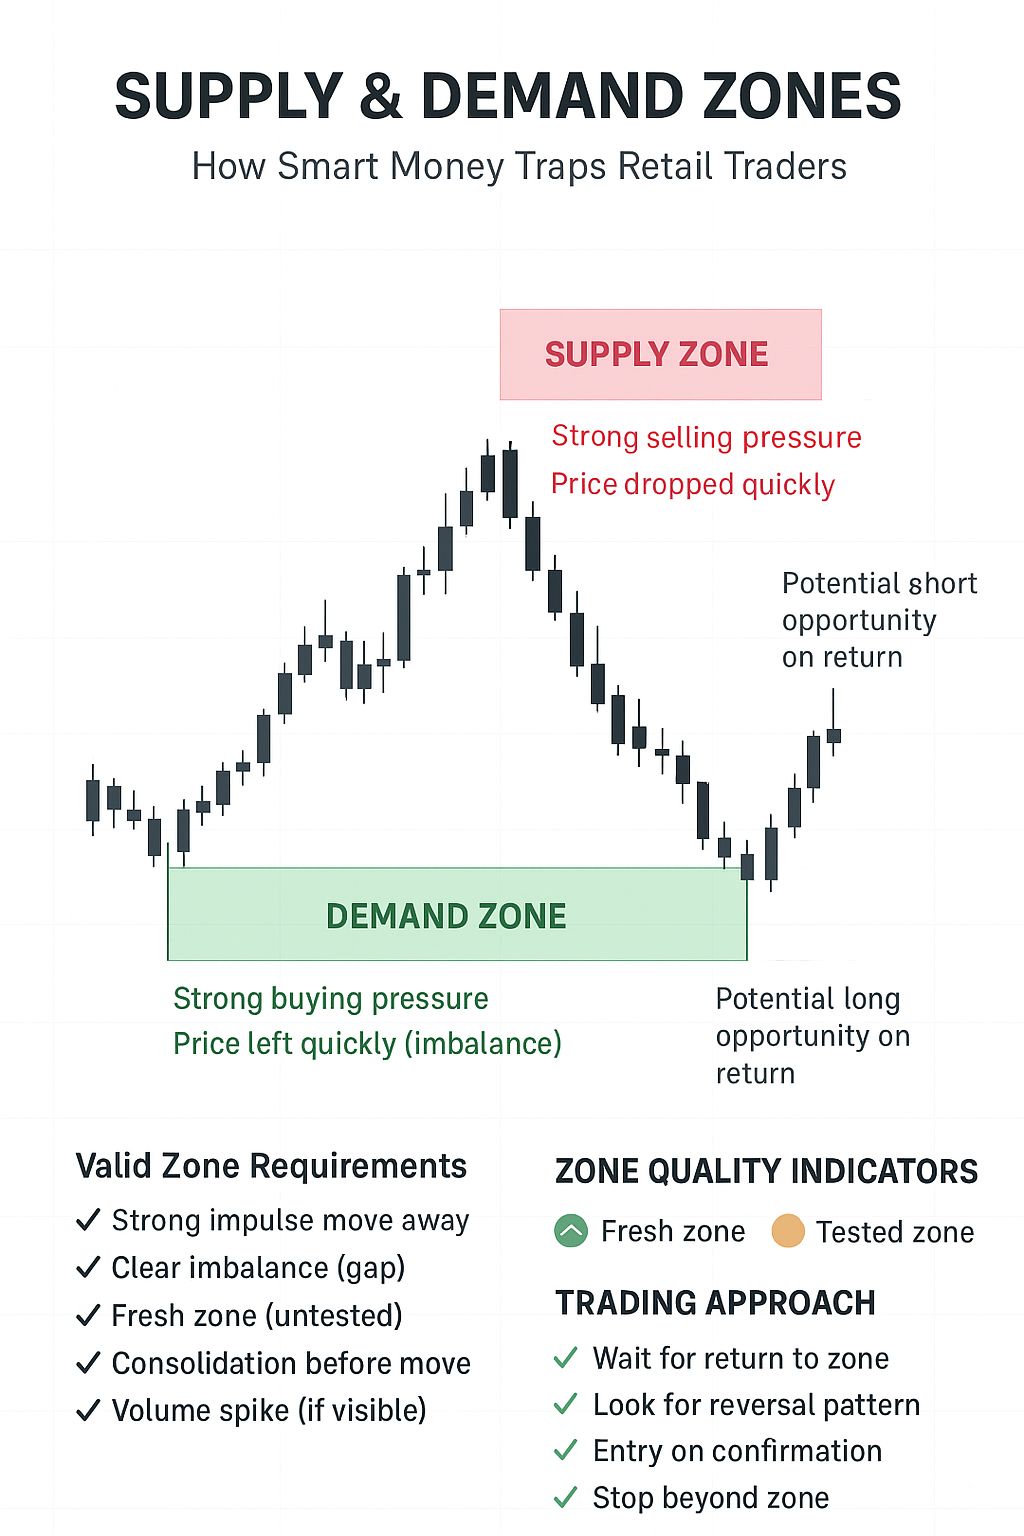
Demand Zone Characteristics
- • Strong bullish impulse move away from zone
- • Price left quickly (indicates imbalance)
- • Fresh zone (not yet retested)
- • Clear consolidation before impulse
- • Long opportunity on return to zone
Supply Zone Characteristics
- • Strong bearish impulse move away from zone
- • Price dropped quickly (indicates imbalance)
- • Fresh zone (not yet retested)
- • Clear consolidation before impulse
- • Short opportunity on return to zone
Complete Price Action Trade Example
Let's walk through a complete trade from analysis to execution, showing how to combine all price action concepts for a high-probability setup.
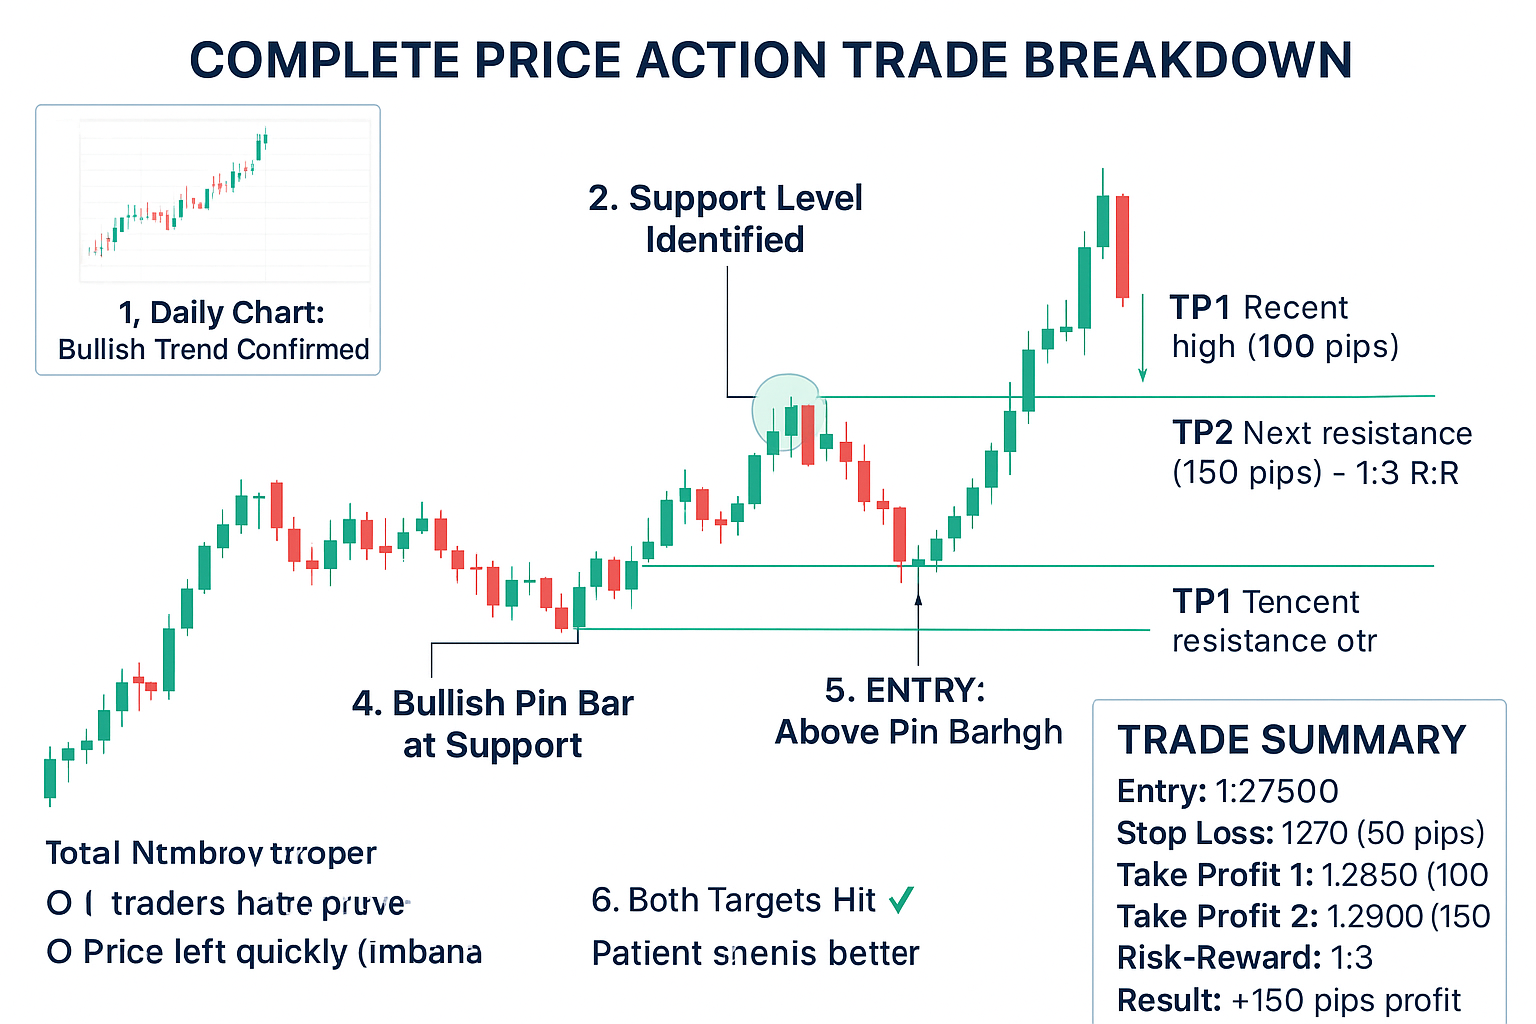
Step-by-Step Trade Execution
- 1
Daily Trend Analysis
Identified clear uptrend on daily chart with higher highs and higher lows. Bullish bias confirmed.
- 2
Key Level Identification
Marked support level on 4-hour chart where price bounced twice before. This is our zone of interest.
- 3
Waited for Pullback
Price retraced to support level, coinciding with 61.8% Fibonacci retracement. Confluence increases probability.
- 4
Pattern Formation
Bullish pin bar formed at support on 1-hour chart. Long lower wick, small body in upper third, no upper wick.
- 5
Entry Execution
Entered 2 pips above pin bar high. Stop loss 5 pips below pin bar low. Risk: 50 pips.
- 6
Trade Management
TP1 at recent high (100 pips, 1:2 R:R) ✓ Hit. TP2 at next resistance (150 pips, 1:3 R:R) ✓ Hit. Total profit: +150 pips.
Common Price Action Trading Mistakes
Even experienced traders make these mistakes. Avoid them to dramatically improve your results:
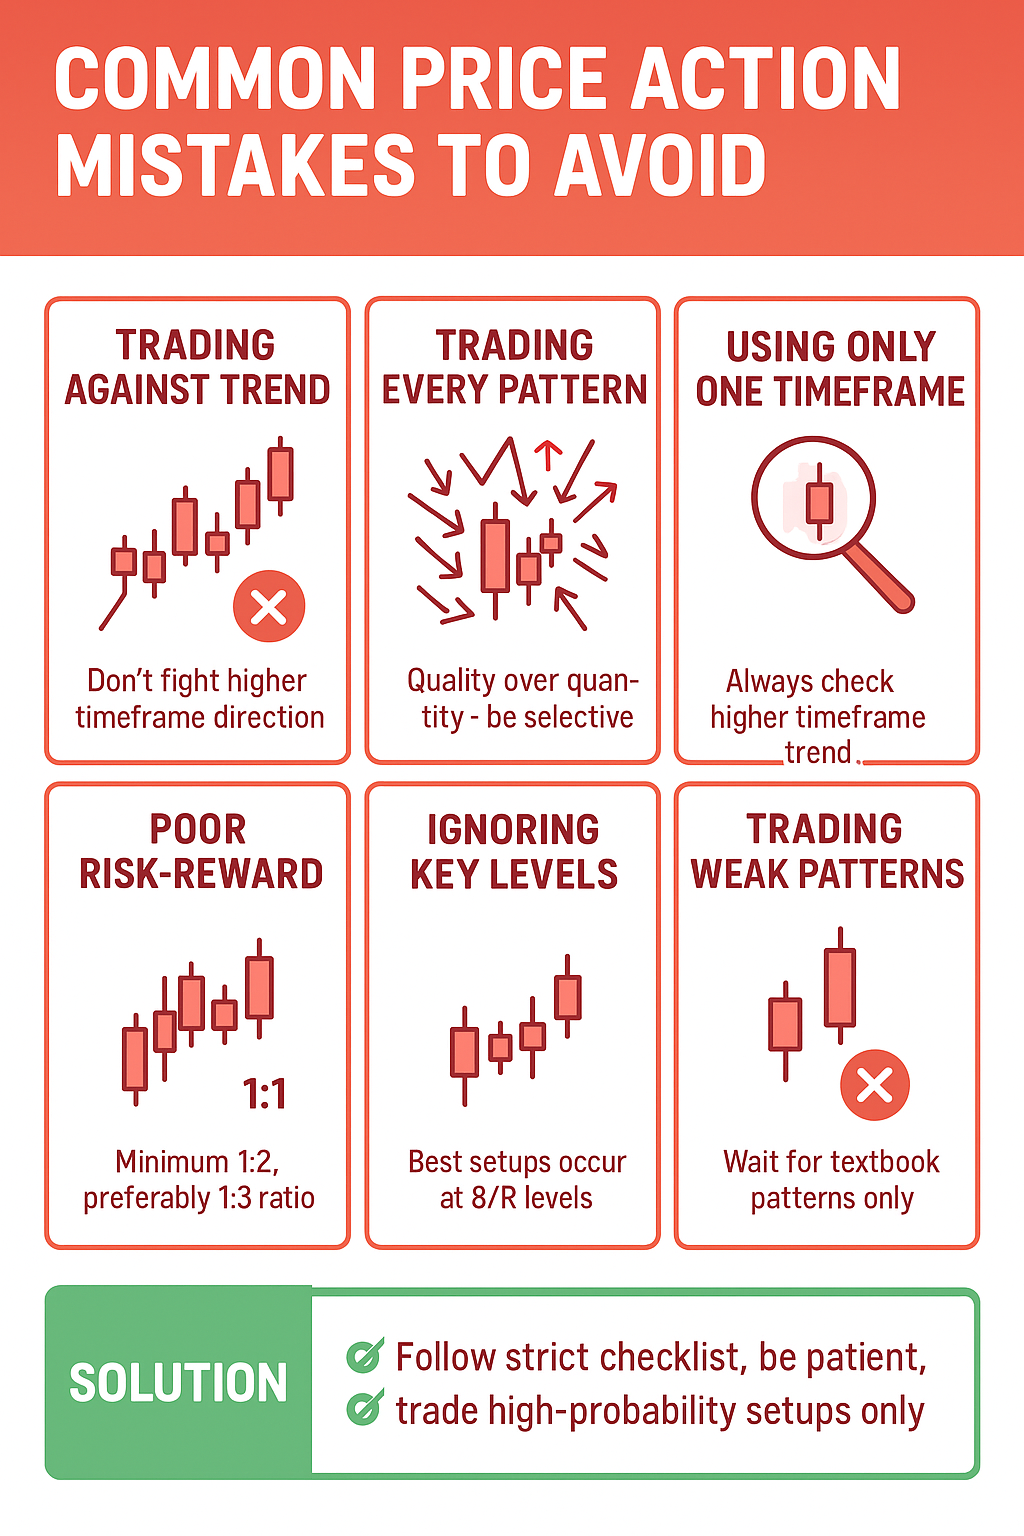
Trading Against the Trend
Counter-trend trading has low probability. Always trade with higher timeframe direction. "Trend is your friend" isn't cliché - it's statistical fact.
Trading Every Pattern
Not all pin bars or inside bars are equal. Quality over quantity. Only trade textbook patterns at key levels with trend alignment.
Using Only One Timeframe
Single timeframe view misses the bigger picture. Always check higher timeframe for trend direction and key levels before entering.
Poor Risk-Reward Ratios
Taking 1:1 or worse risk-reward trades requires unrealistic win rates. Aim for minimum 1:2, preferably 1:3 to stay profitable long-term.
Ignoring Key Levels
Random entries away from support/resistance have low probability. Best price action setups occur at key levels where institutional orders sit.
Not Journaling Trades
Without tracking patterns and results, you can't improve. Journal every trade with screenshots, reasoning, and emotional state.
Getting Started with Price Action Trading
Price action trading is a skill that improves with practice. Follow this structured learning path to master the methodology:
Your 90-Day Price Action Mastery Plan
Weeks 1-2: Pattern Recognition
Study charts daily. Mark every pin bar, inside bar, and engulfing pattern you see. Learn to identify quality vs mediocre patterns.
Weeks 3-4: Support & Resistance
Draw levels on historical charts. See how price reacts at these zones. Learn what makes a level strong vs weak.
Weeks 5-8: Demo Trading
Trade demo account using price action only. Follow your checklist strictly. Journal every trade. Aim for 60%+ win rate.
Weeks 9-12: Refinement
Focus on your best setup (pin bar recommended). Trade only that pattern. Master one before expanding to others.
After 90 Days: Live Trading
Start with small position sizes. Gradually increase as confidence grows. Never stop journaling and reviewing trades.
Key Takeaways
- Price action trading removes lagging indicators for real-time market analysis
- Master pin bars, inside bars, and engulfing patterns first
- Always trade at key support/resistance levels with trend alignment
- Use multiple timeframe analysis - daily for trend, lower for entry
- Fibonacci 61.8% retracement offers optimal risk-reward entries
- Avoid false breakouts by waiting for retest and confirmation
- Supply/demand zones are more accurate than simple lines
- Quality over quantity - be selective and patient with entries
- Minimum 1:2 risk-reward, aim for 1:3 for long-term profitability
- Practice 90 days on demo before risking real capital