Breakout Trading Strategy: Complete Guide
Master one of the most powerful and profitable trading strategies. Learn to identify and trade breakouts like professional traders for consistent profits.
What is Breakout Trading?
Breakout trading is one of the most powerful and widely-used trading strategies in financial markets, employed by both retail traders and institutional investors. A breakout occurs when the price of an asset decisively moves beyond a well-defined support or resistance level, typically accompanied by increased trading volume, signaling the beginning of a new trend or the continuation of an existing one. This strategy capitalizes on the principle that when price breaks through significant consolidation zones, it often continues in that direction with substantial momentum.
💡 The Core Principle:
When price breaks through a significant level where it has been consolidating for an extended period, it represents a fundamental shift in market psychology. The breakout occurs when one side of the market (buyers or sellers) gains overwhelming control, pushing price beyond previous boundaries. This creates a self-reinforcing cycle: as price moves in the breakout direction, more traders recognize the move and join in, further propelling price in that direction. The key to successful breakout trading lies in identifying these moments early and entering with proper risk management.
Why Breakout Trading Works: Breakouts work because they represent clear moments when supply and demand imbalances become evident. When price breaks above resistance, it signals that buyers have overwhelmed sellers at that level, and the market is ready to move higher. Conversely, when price breaks below support, sellers have taken control. These breakouts often attract algorithmic traders, institutional investors, and momentum traders, creating a cascade effect that can lead to significant price movements. The strategy is particularly effective because it allows traders to enter trends early, often before they become obvious to the broader market.
Professional traders and institutions closely monitor breakout levels because they represent high-probability trading opportunities with excellent risk-reward characteristics. A well-identified breakout can provide risk-reward ratios of 1:2, 1:3, or higher, with stop losses strategically placed just below (for bullish breakouts) or above (for bearish breakouts) the broken level. This makes breakout trading one of the most efficient ways to capture significant market moves while maintaining tight risk control.
This comprehensive 2025 guide will teach you everything you need to master breakout trading, from identifying strong support and resistance levels to executing trades with proper risk management. You'll learn to distinguish between real breakouts and false breakouts (fakeouts), use volume confirmation to validate breakouts, apply breakout strategies across different chart patterns (triangles, rectangles, flags, pennants), and develop a complete trading system that can be applied across all timeframes and markets. Whether you're trading forex, stocks, cryptocurrencies, or commodities, the principles of breakout trading remain consistent and highly effective.
💡 Key Breakout Trading Statistics
- ✓ Universal Application: Breakouts work effectively on all timeframes from 1-minute scalping to monthly position trading
- ✓ Volume Impact: Volume confirmation increases breakout success rate by 40-60%, making it one of the most important factors
- ✓ False Breakout Frequency: Approximately 30-40% of breakouts are false—learning to identify them is crucial for profitability
- ✓ Optimal Consolidation: The most reliable breakouts occur after consolidation periods of 2-4 weeks, allowing pent-up pressure to build
- ✓ Risk-Reward Potential: Proper breakout trading can achieve risk-reward ratios of 1:2, 1:3, or higher, making it highly efficient
- ✓ Market Applicability: Breakout strategies work across all markets: forex, stocks, cryptocurrencies, commodities, and indices
- ✓ Institutional Participation: Breakouts often attract institutional traders, creating self-reinforcing moves
Breakout Trading Basics
Before diving into advanced breakout strategies, it's essential to understand the fundamental concepts that make breakout trading so effective. A breakout is not merely price movement beyond a key level—it represents a fundamental shift in market dynamics where one side (buyers or sellers) gains decisive control. This occurs when price moves beyond a well-established support or resistance level that has contained price action for a significant period, typically accompanied by increased trading volume and strong momentum.
Key Components of a Successful Breakout:
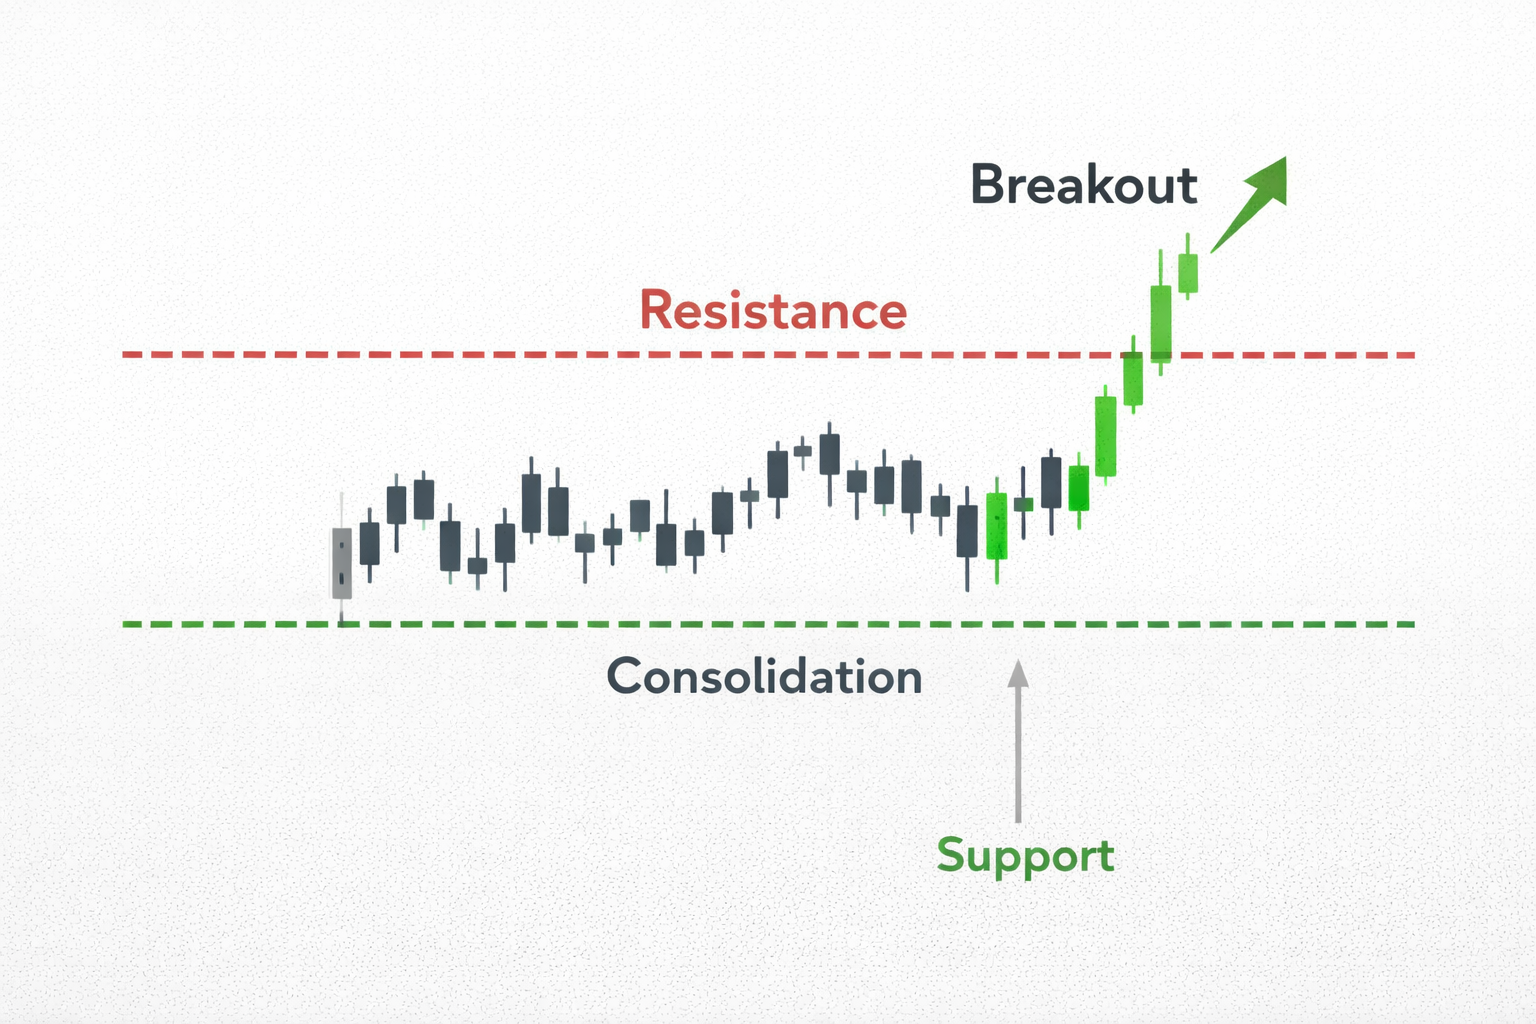
- Consolidation Phase: Price moves sideways between support and resistance, creating a trading range or consolidation pattern. This phase can last from days to months, and the longer the consolidation, the stronger the eventual breakout tends to be. During consolidation, trading volume typically decreases as the market builds energy for the next move.
- Breakout Point: The critical moment when price breaks through the support or resistance level with conviction. This is identified by a strong candle (significantly larger than recent candles) that closes clearly beyond the level, not just wicking through it. The breakout point represents the optimal entry for aggressive traders.
- Volume Confirmation: Increased trading volume during the breakout validates the move's strength and legitimacy. Volume should be 1.5-2x higher than the recent average. Without volume confirmation, breakouts are often false and should be avoided.
- Follow-Through: Price continues in the breakout direction for several candles, confirming the validity of the move. Lack of follow-through within 1-3 candles often indicates a false breakout. Strong follow-through with continued high volume suggests the breakout is genuine and likely to continue.
- Level Strength: The stronger the support or resistance level (tested multiple times, held for extended periods), the more significant the breakout becomes. Breakouts of weak or recently created levels are less reliable.
The most reliable breakouts occur after extended consolidation periods of 2-4 weeks or longer. When price has been range-bound for weeks or months, the eventual breakout often carries significant momentum because pent-up buying or selling pressure is released. This is similar to a coiled spring—the longer it's compressed, the more force it releases when it breaks free. Professional traders watch for these extended consolidation periods as they often precede the most profitable breakout moves.
Understanding Breakout Psychology: Breakouts work because they represent moments when market participants who were waiting on the sidelines finally commit. When price breaks above resistance, it signals to all market participants that buyers are in control, attracting more buyers and creating a self-reinforcing cycle. This is why breakouts often lead to strong, sustained moves rather than quick reversals.
Support and Resistance Levels
Support and resistance levels are the foundation of breakout trading. These levels represent price points where buying (support) or selling (resistance) pressure has historically been strong enough to halt or reverse price movement.
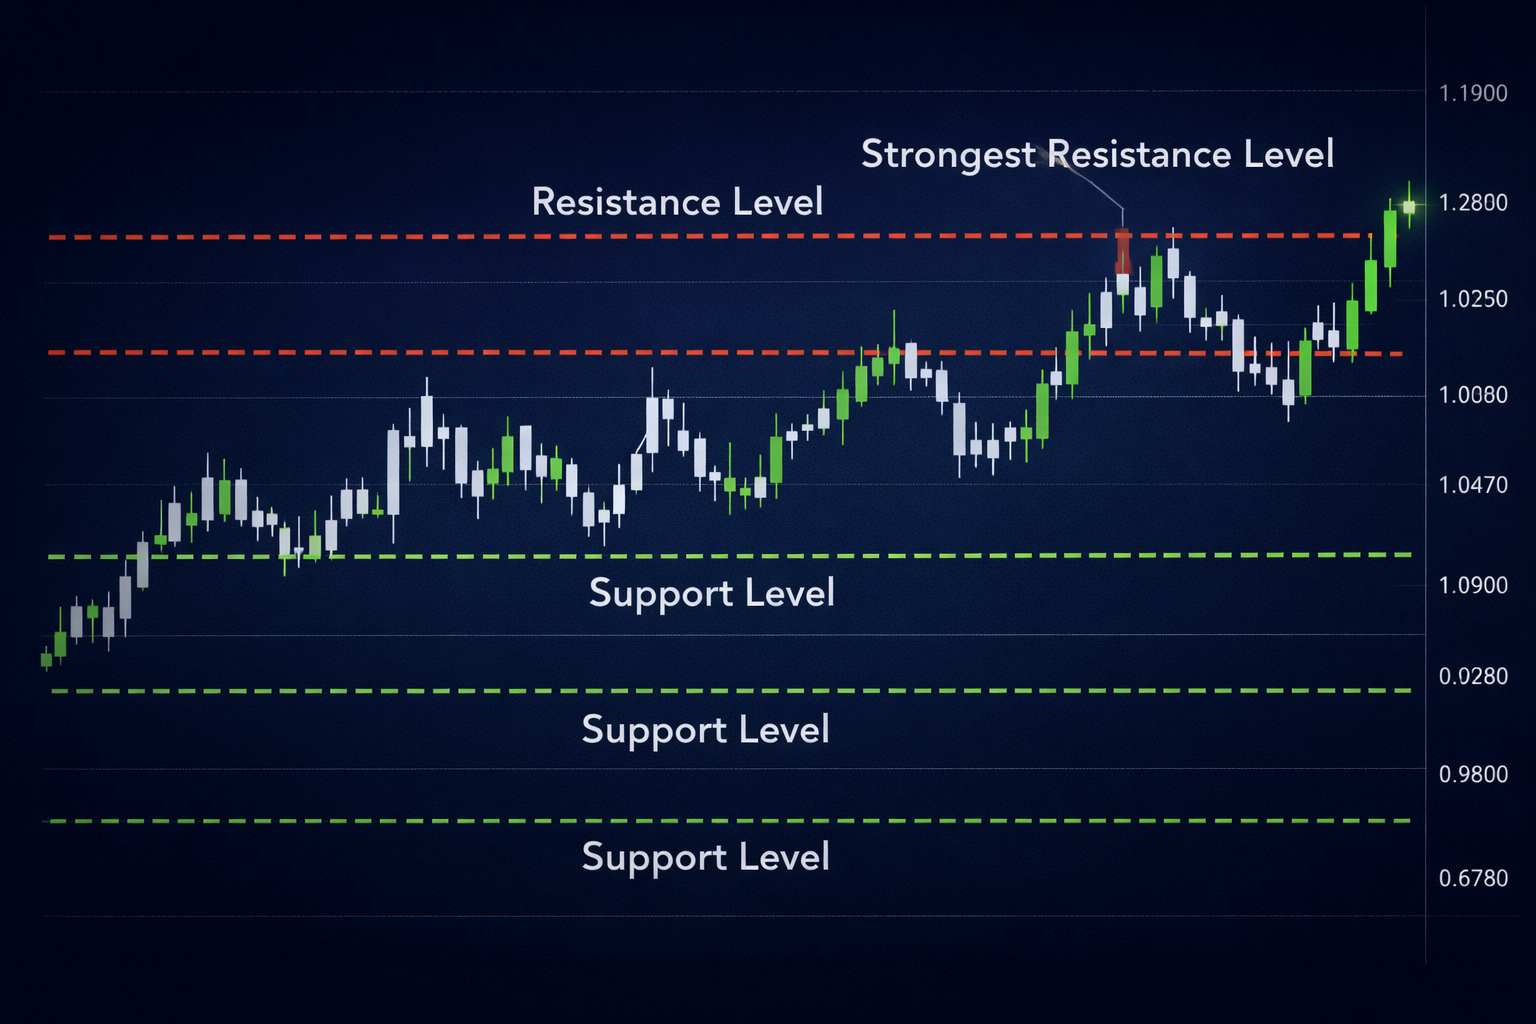
Identifying Strong Support and Resistance:
- Multiple Touches: Levels that have been tested 3+ times are stronger than those tested only once.
- Time Factor: Levels that have held for weeks or months are more significant than recent levels.
- Volume at Level: High volume at a level indicates strong institutional interest.
- Round Numbers: Psychological levels (like 1.2000, 1.3000) often act as support/resistance.
- Previous Highs/Lows: Historical price extremes create natural support and resistance.
The stronger the support or resistance level, the more significant the breakout becomes. A breakout above a resistance level that has held for months and been tested multiple times is far more reliable than a breakout above a level created yesterday.
Bullish Breakout Patterns
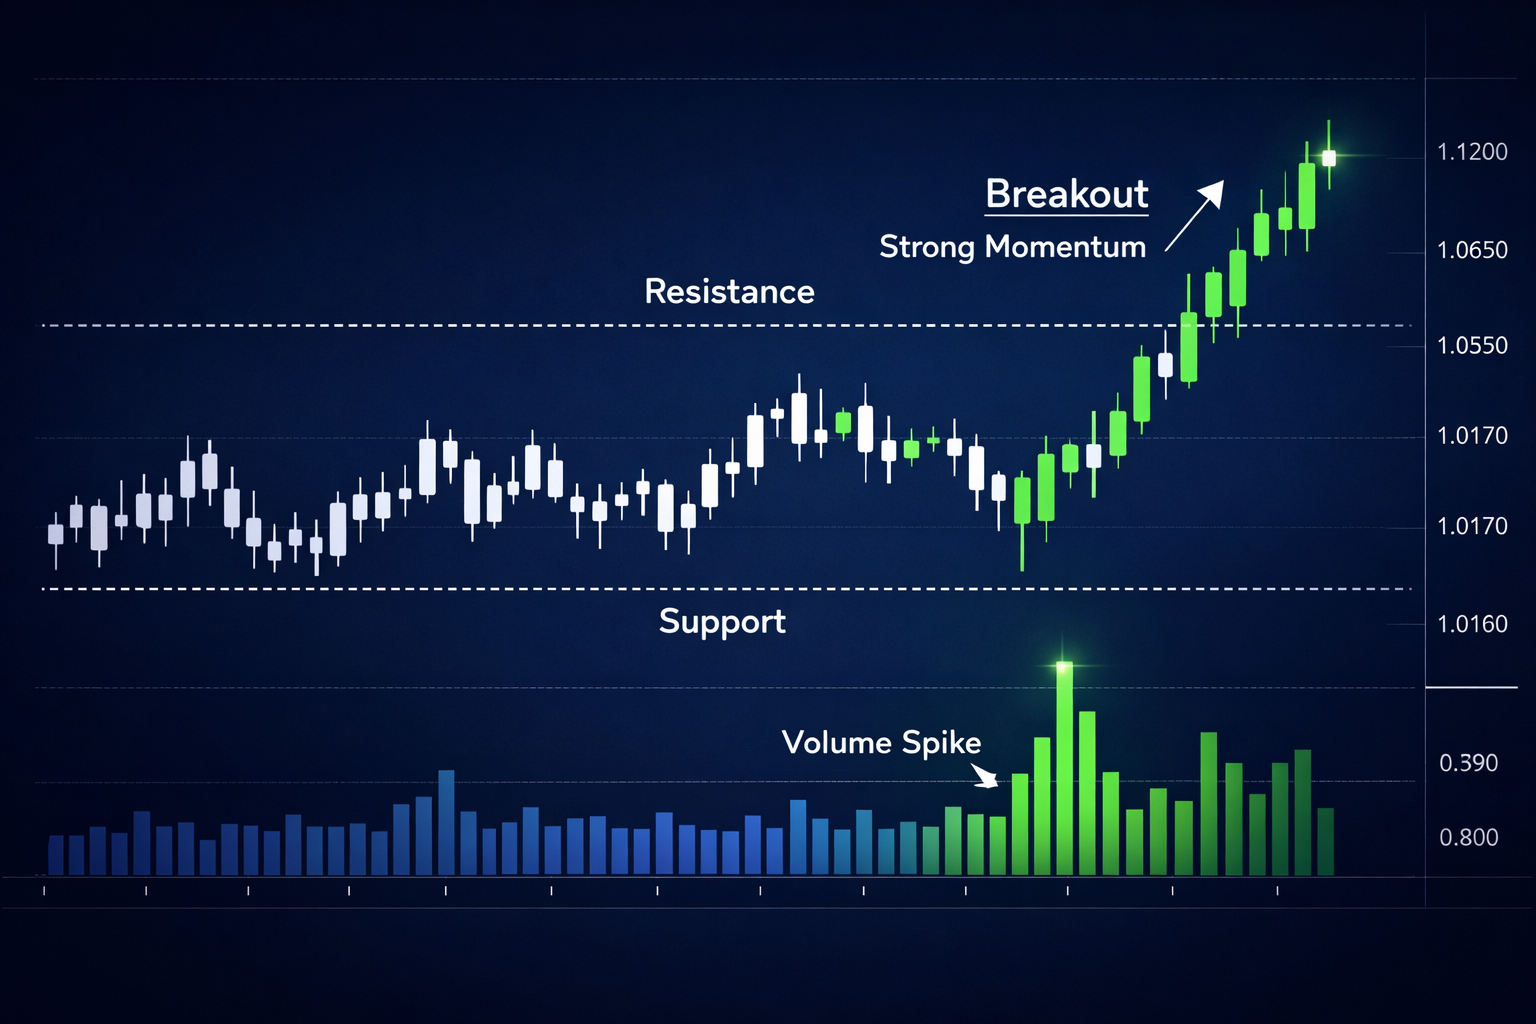
A bullish breakout occurs when price breaks above a resistance level, signaling that buyers have gained control and are pushing price higher. These breakouts often lead to strong upward trends and can provide excellent trading opportunities.
Characteristics of a Strong Bullish Breakout:
- Strong Candle: The breakout candle should be significantly larger than recent candles, showing conviction.
- Volume Spike: Trading volume should be 1.5-2x higher than average during the breakout.
- Clean Break: Price should close clearly above resistance, not just wick through it.
- Follow-Through: Subsequent candles should continue higher, confirming the breakout.
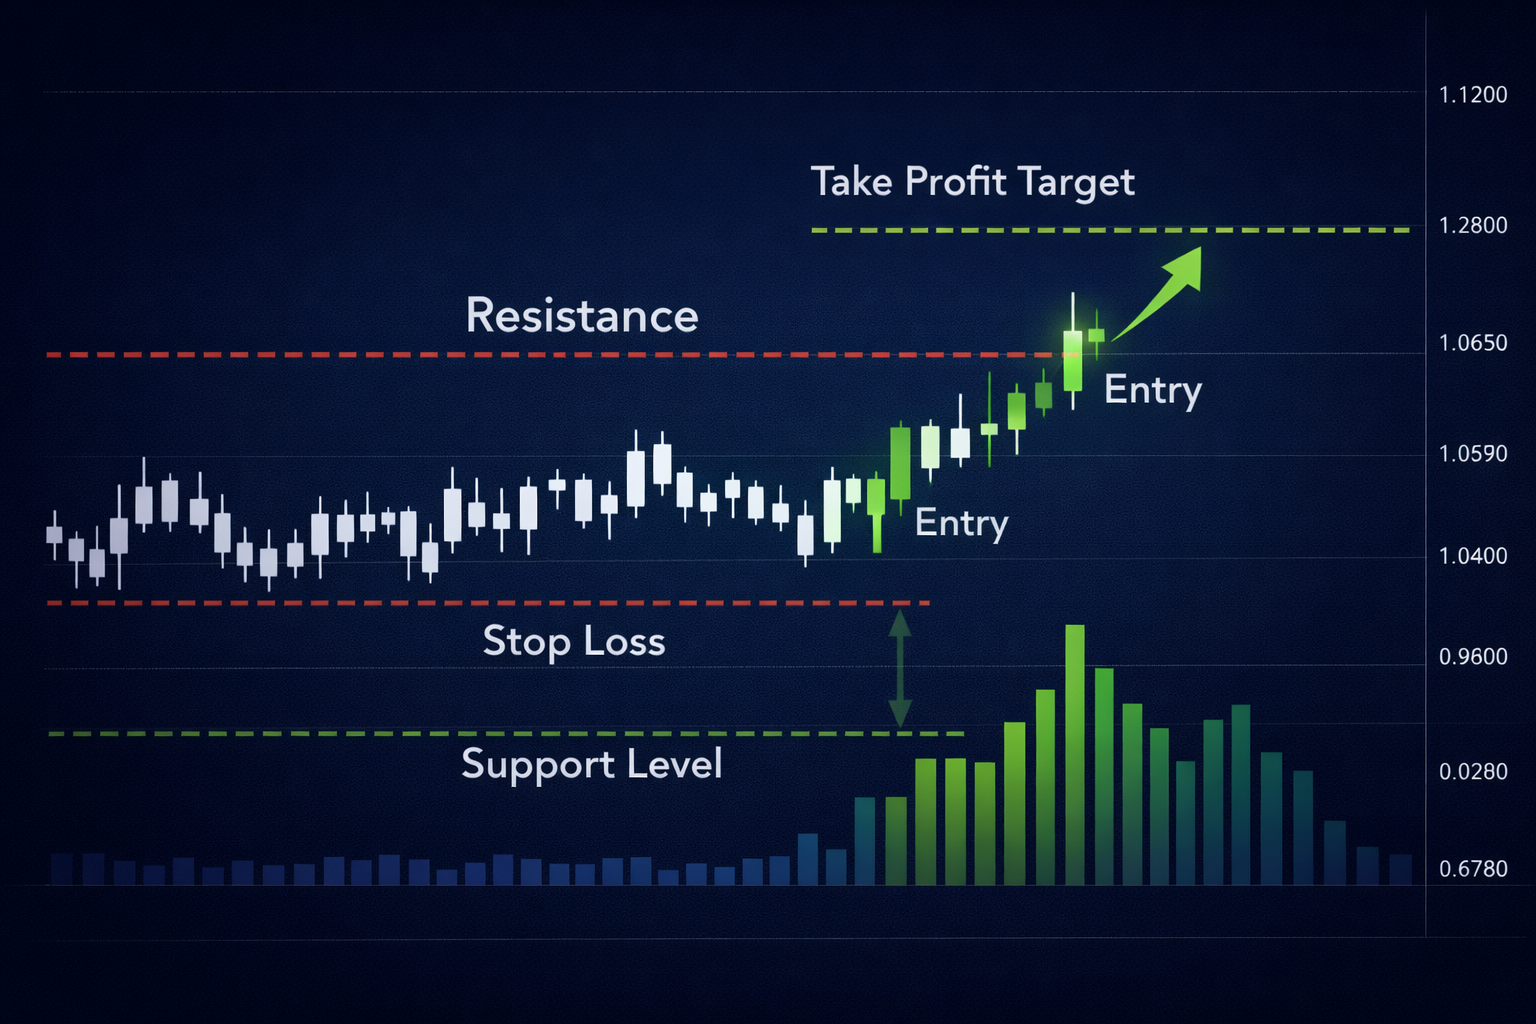
Trading a Bullish Breakout:
- Identify a strong resistance level that has been tested multiple times.
- Wait for price to break above resistance with a strong candle and increased volume.
- Enter the trade at the breakout point or on a pullback to the broken resistance (now support).
- Place stop loss just below the broken resistance level.
- Set take profit targets at 1:2, 1:3, or higher risk-reward ratios.
Bearish Breakout Patterns
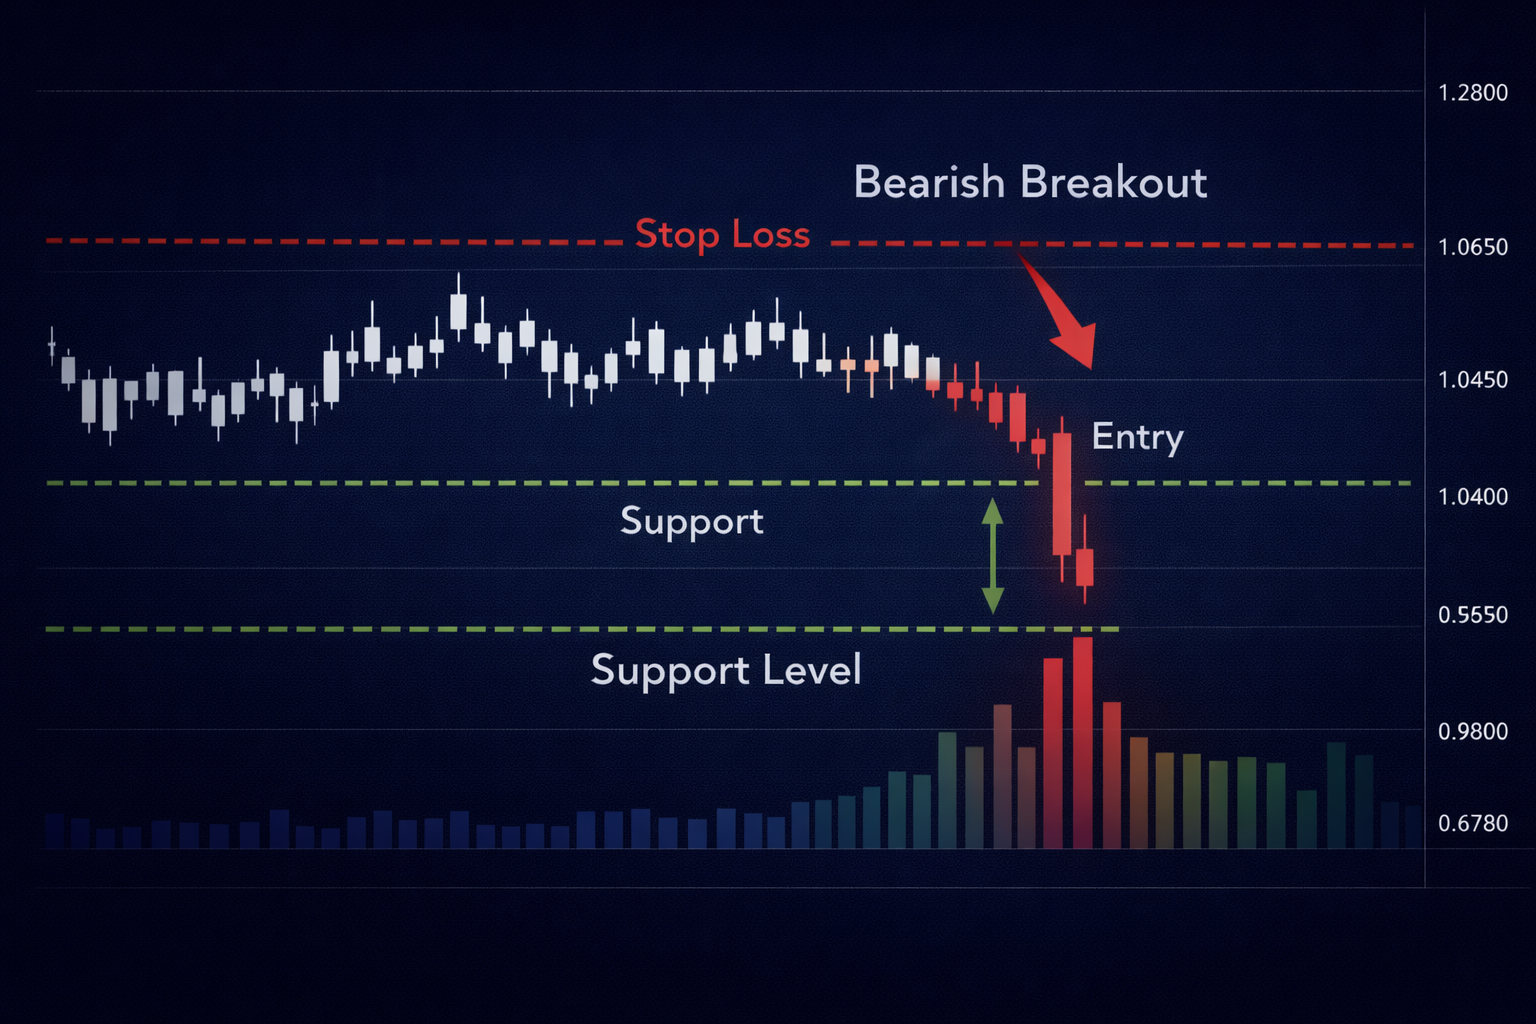
A bearish breakout (also called a breakdown) occurs when price breaks below a support level, indicating that sellers have overwhelmed buyers and are pushing price lower. These breakouts can lead to sharp declines and profitable short-selling opportunities.
Characteristics of a Strong Bearish Breakout:
- Strong Red Candle: The breakdown candle should be large and red, showing selling pressure.
- Volume Confirmation: High volume during the breakdown validates the move.
- Clean Break: Price should close clearly below support, not just wick through it.
- No Immediate Bounce: Price should not immediately bounce back above support.
Trading a Bearish Breakout:
- Identify a strong support level that has held price multiple times.
- Wait for price to break below support with a strong red candle and increased volume.
- Enter short at the breakdown point or on a pullback to the broken support (now resistance).
- Place stop loss just above the broken support level.
- Set take profit targets based on the height of the previous consolidation range.
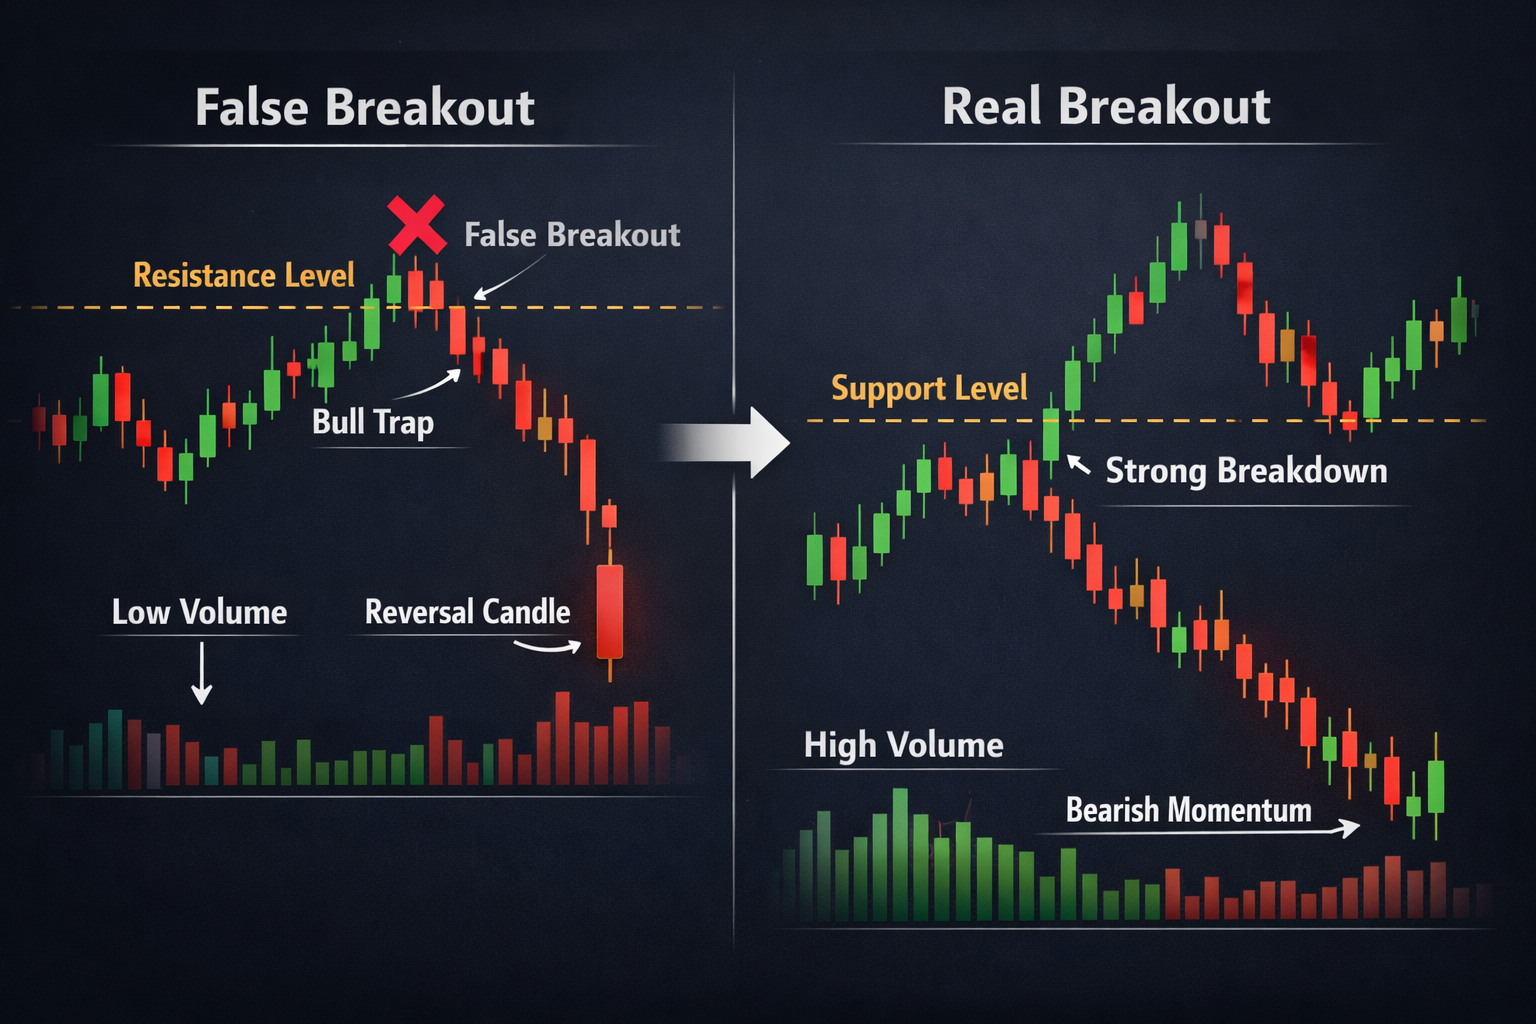
False Breakouts (Fakeouts)
False breakouts, also called fakeouts, are one of the biggest challenges in breakout trading. A false breakout occurs when price breaks through a support or resistance level but immediately reverses, trapping traders who entered on the breakout.
How to Identify False Breakouts:
- Low Volume: False breakouts often occur on low volume, indicating lack of conviction.
- Wick Rejection: Price wicks through the level but closes back inside the range.
- Quick Reversal: Price reverses within 1-3 candles after the breakout.
- No Follow-Through: Subsequent candles fail to continue in the breakout direction.
- Weak Candle: The breakout candle is small or has long wicks, showing indecision.
Protecting Against False Breakouts:
- Always wait for volume confirmation before entering.
- Enter on pullbacks rather than at the exact breakout point.
- Use tight stop losses to limit losses if it's a fakeout.
- Wait for price to close clearly beyond the level, not just wick through it.
- Consider the overall market context—breakouts in the direction of the larger trend are more reliable.
Volume Confirmation
Volume is one of the most important confirmation tools in breakout trading. A breakout with high volume is far more likely to succeed than a breakout on low volume. Volume represents the number of shares or contracts traded, indicating the level of interest and conviction behind the move.
Volume Analysis for Breakouts:
- Low Volume During Consolidation: Indicates lack of interest and potential for a strong move when breakout occurs.
- High Volume on Breakout: Shows strong conviction and increases the probability of success.
- Volume Should Be 1.5-2x Average: For a breakout to be valid, volume should be significantly higher than the recent average.
- Sustained Volume: Volume should remain elevated for several candles after the breakout, not just spike once.
Volume Patterns to Watch:
- Accumulation Phase: Gradually increasing volume as price approaches resistance suggests institutional accumulation.
- Breakout Volume: Sudden volume spike during breakout indicates strong buying/selling pressure.
- Follow-Through Volume: Continued high volume after breakout confirms the move's validity.
Remember: A breakout without volume confirmation is like a car without fuel—it may start moving but won't go far. Always check volume before entering a breakout trade.
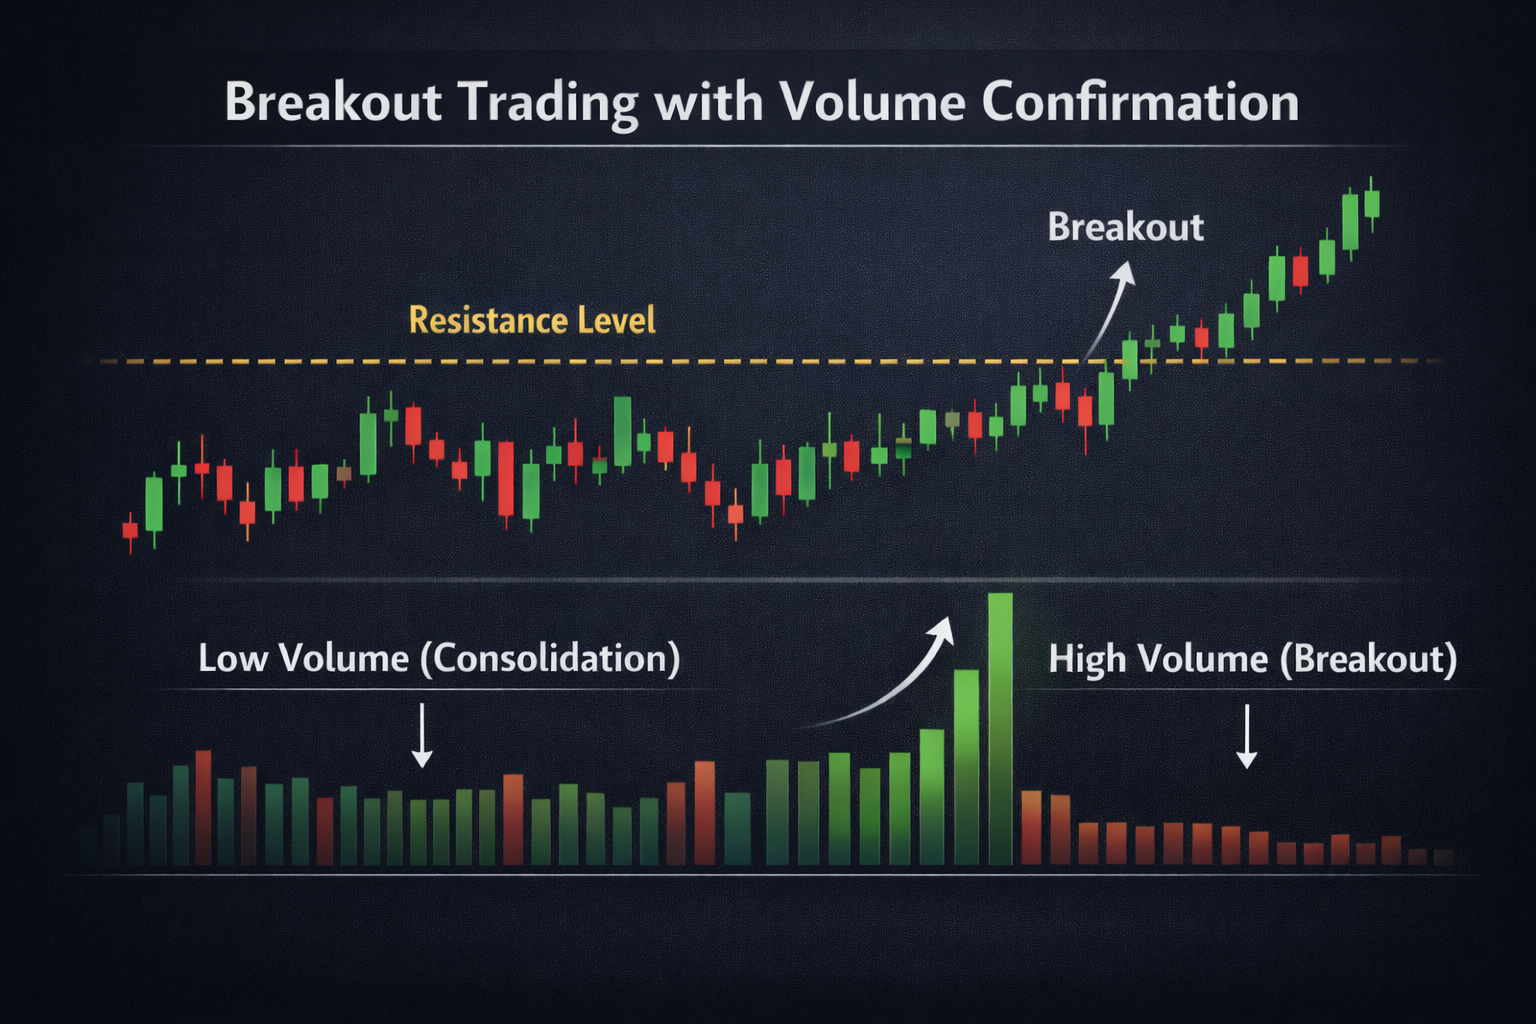
Chart Pattern Breakouts
Many chart patterns are essentially consolidation formations that lead to breakouts. Recognizing these patterns can help you anticipate breakouts and position yourself for profitable trades.
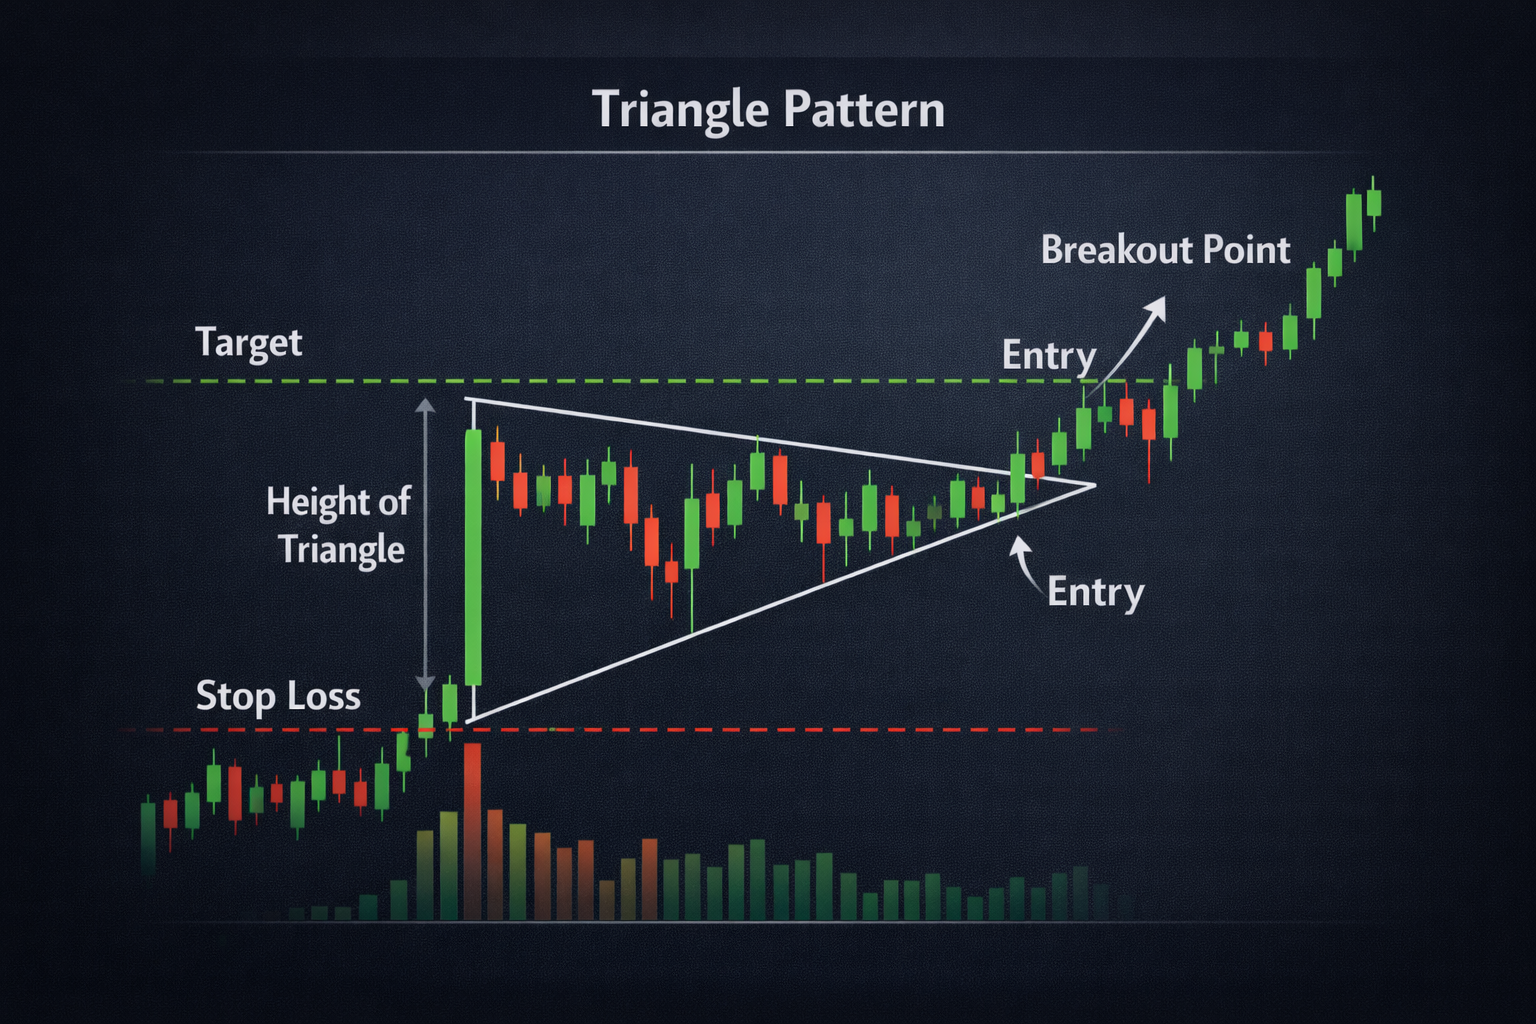
Triangle Patterns:
Triangles are formed when price consolidates in a narrowing range. There are three main types:
- Ascending Triangle: Horizontal resistance with rising support. Bullish pattern—expect breakout upward.
- Descending Triangle: Horizontal support with falling resistance. Bearish pattern—expect breakdown downward.
- Symmetrical Triangle: Converging support and resistance. Breakout direction is determined by the prevailing trend.
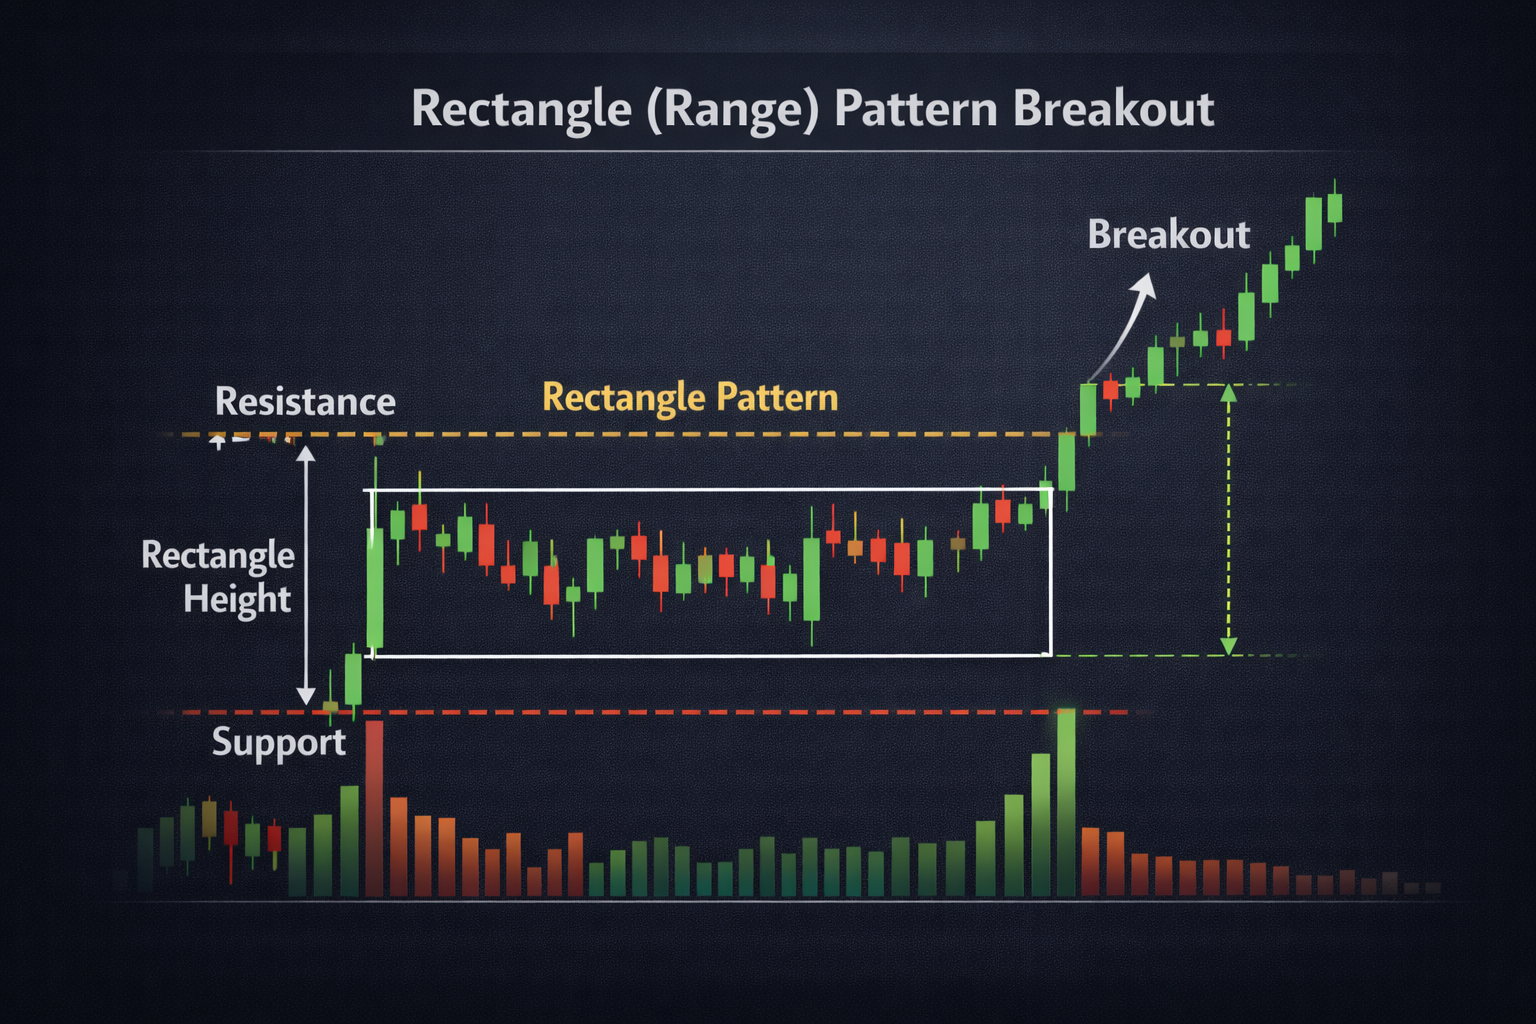
Rectangle Patterns:
Rectangles (also called trading ranges) form when price moves between parallel support and resistance levels. The longer the rectangle, the stronger the eventual breakout tends to be. Measure the height of the rectangle to project potential targets.
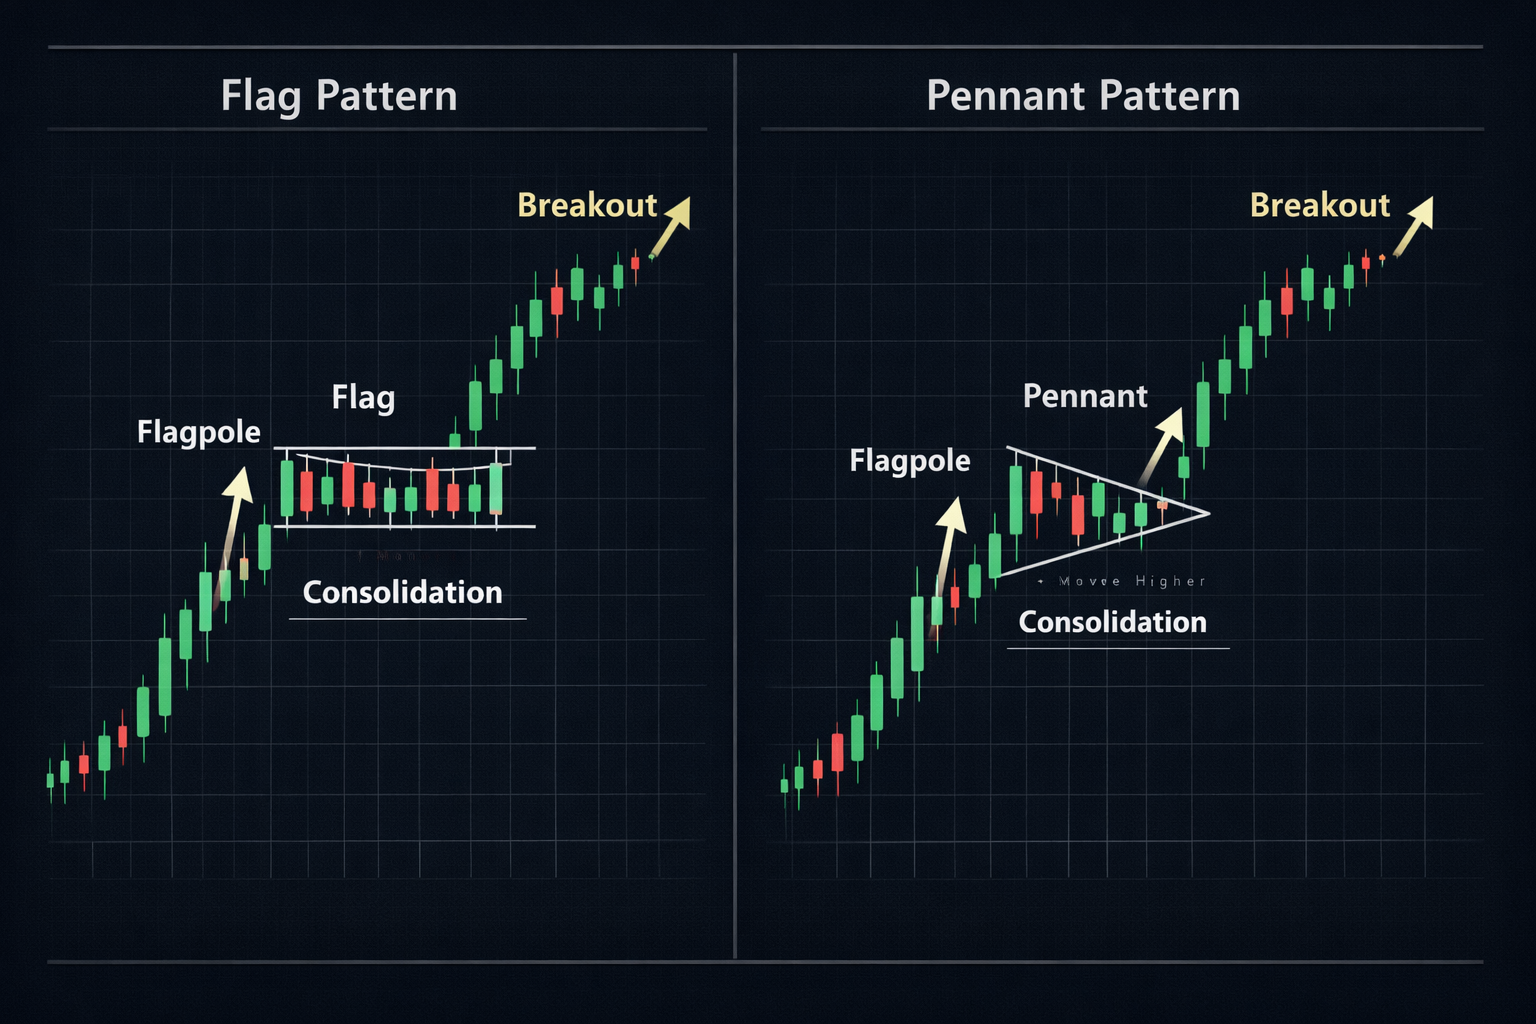
Flag and Pennant Patterns:
These are continuation patterns that occur after strong moves. Flags are rectangular consolidations, while pennants are triangular. Both typically break in the direction of the preceding trend, offering excellent trading opportunities.
Entry Strategies
There are several ways to enter a breakout trade, each with its own advantages and risk profile. The best entry method depends on your risk tolerance, trading style, and the specific breakout setup.
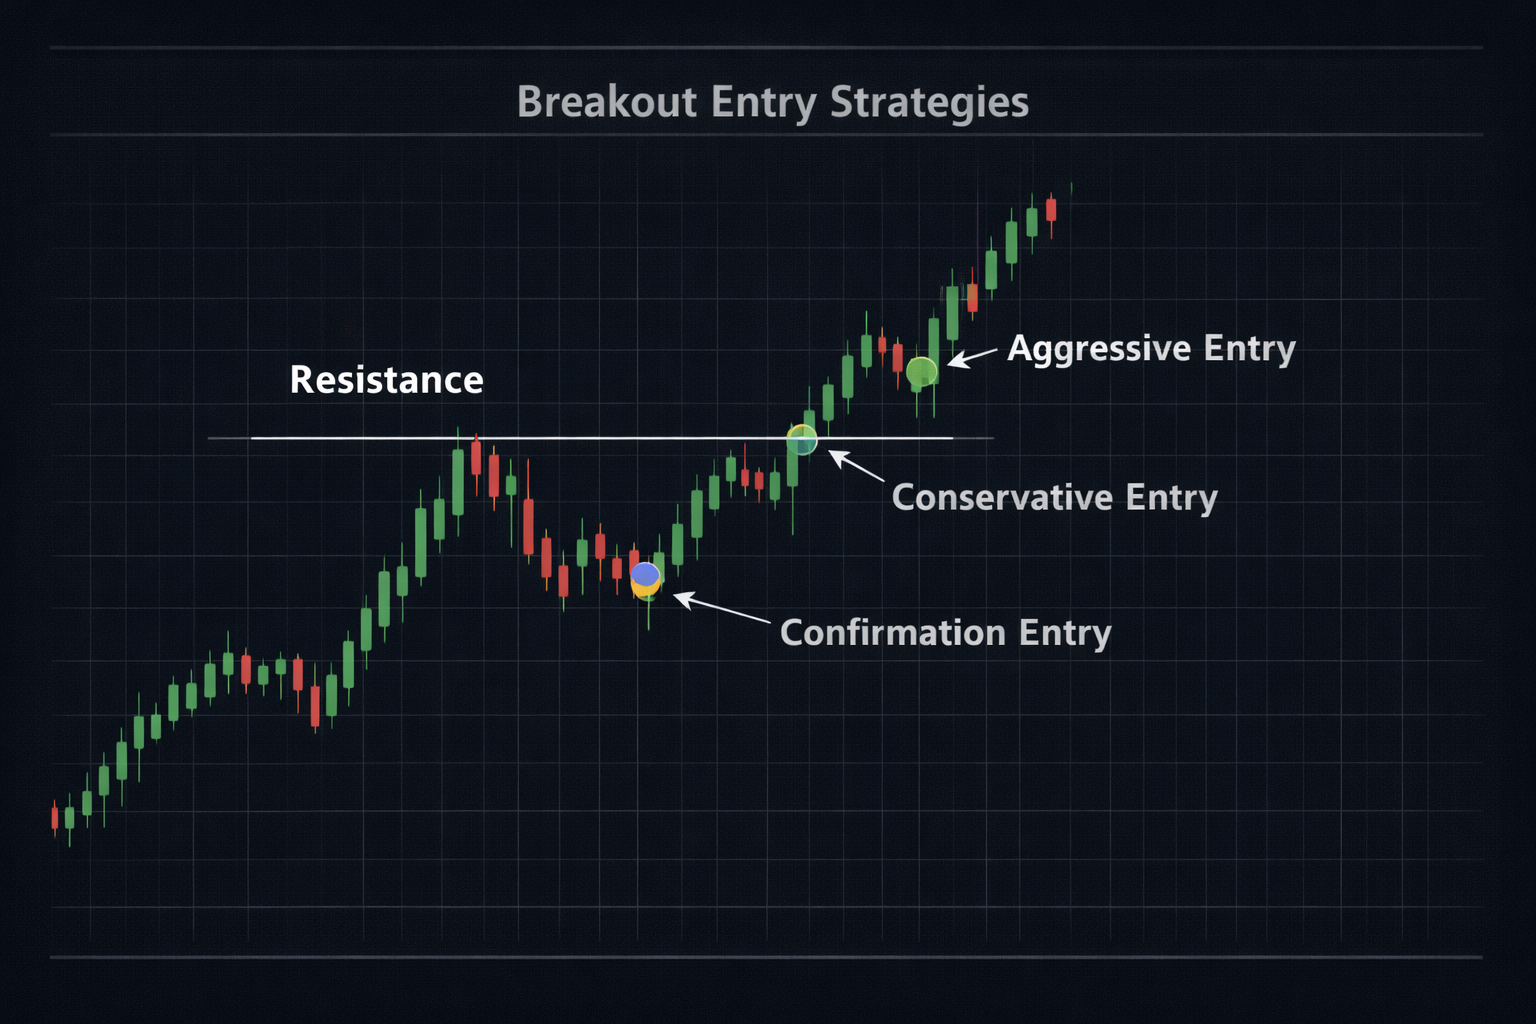
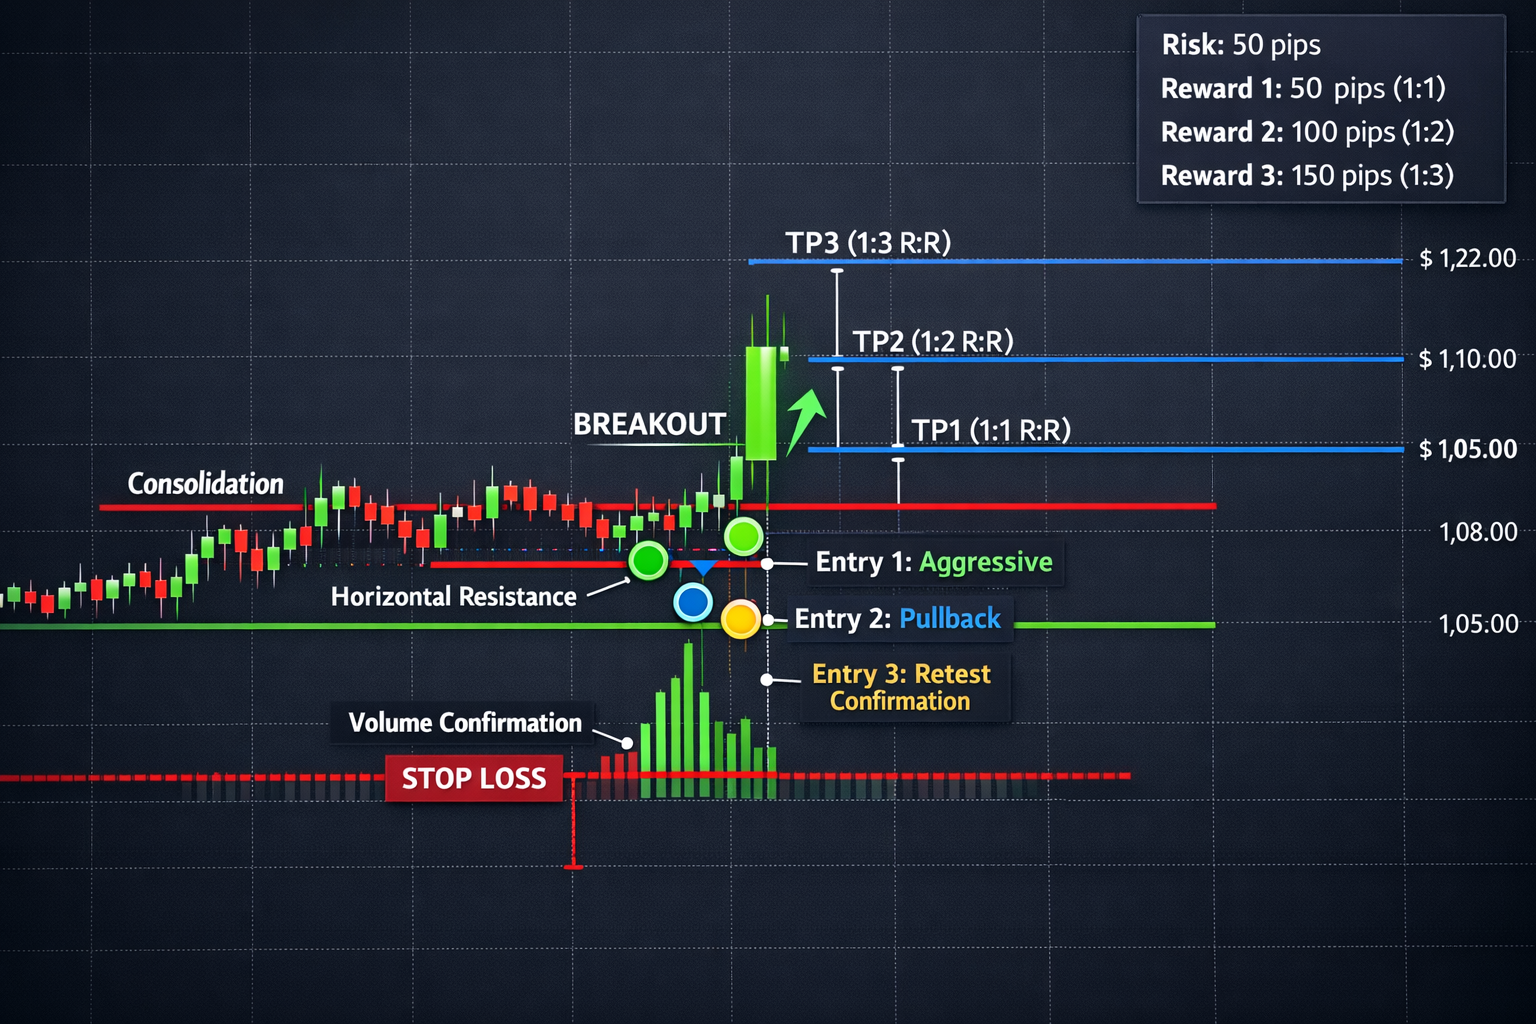
1. Aggressive Entry (At Breakout Point):
Enter immediately when price breaks through the level. This method captures the full move but has a higher risk of false breakouts. Best for: Strong breakouts with high volume and clear momentum.
2. Conservative Entry (Pullback Entry):
Wait for price to break out, then enter on a pullback to the broken level (which now acts as support/resistance). This method has lower risk but may miss the move if there's no pullback. Best for: Traders who prefer lower risk and better entry prices.
3. Confirmation Entry (After Retest):
Wait for price to break out, pull back to test the broken level, and then bounce. Enter after the bounce confirms the breakout. This is the safest method but may result in missing the initial move. Best for: Conservative traders and high-probability setups.
Entry Tips:
- Use limit orders for pullback entries to get better prices.
- Consider partial entries—enter 50% at breakout, 50% on pullback.
- Always use stop losses regardless of entry method.
- Enter during high-volume periods for better execution.
Risk Management
Proper risk management is crucial for successful breakout trading. Breakouts can be volatile, and false breakouts are common, so protecting your capital is essential.
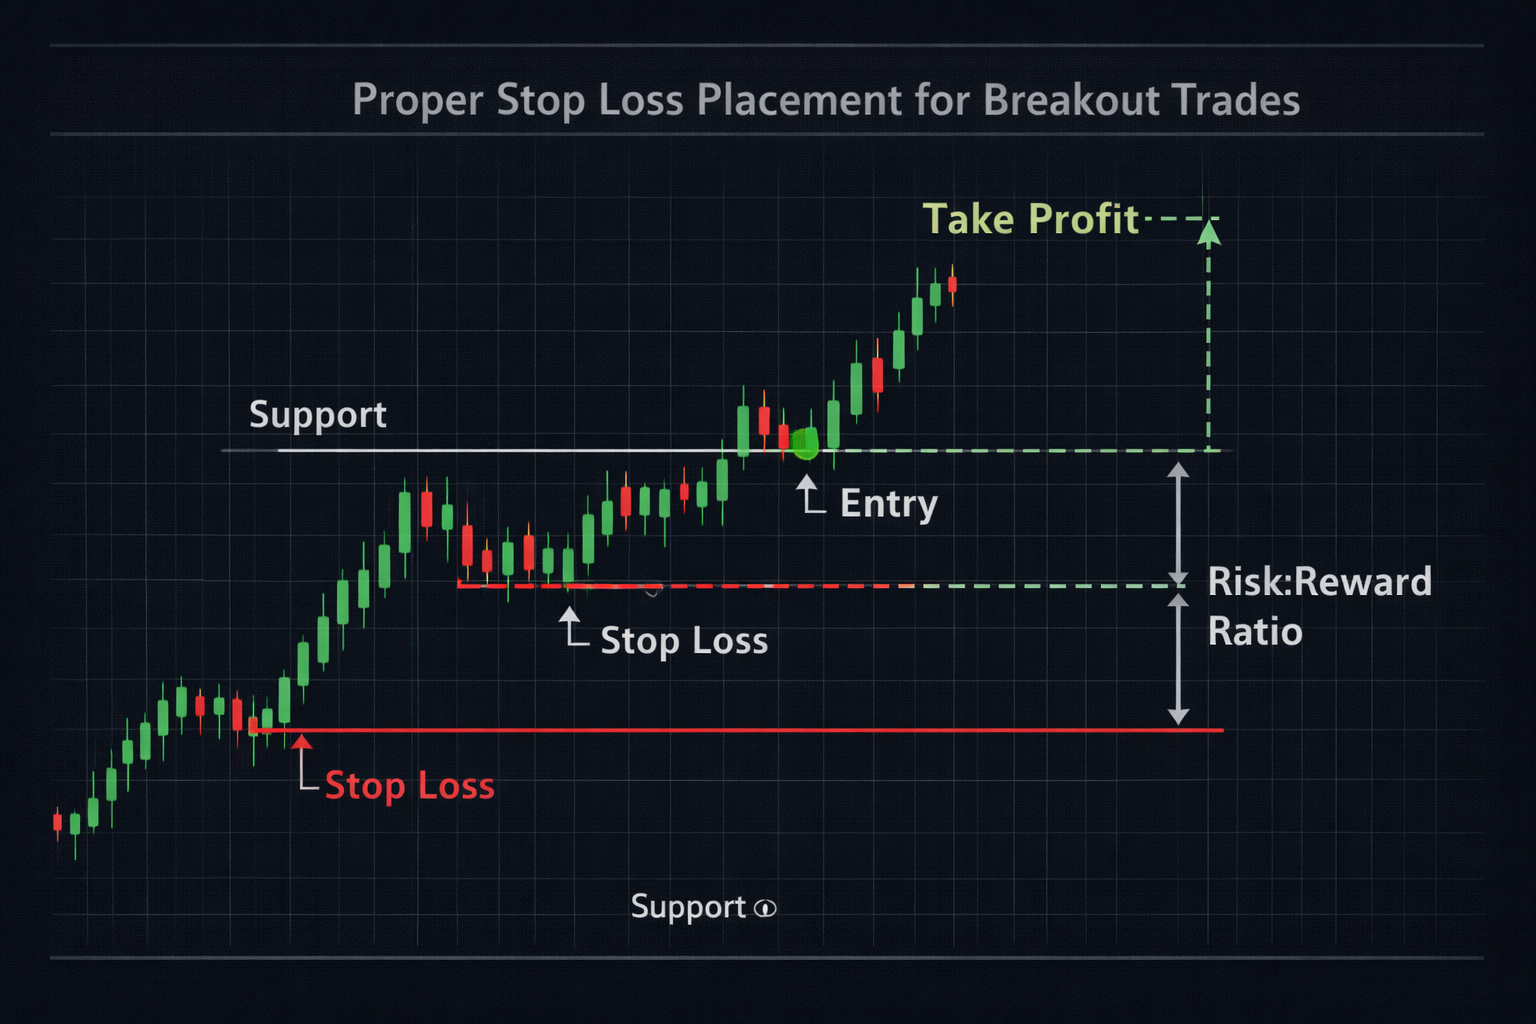
Stop Loss Placement:
For bullish breakouts, place your stop loss just below the broken resistance level (now support). For bearish breakouts, place it just above the broken support level (now resistance). This ensures you're stopped out if the breakout fails and price returns to the range.
Position Sizing:
Never risk more than 1-2% of your account on a single breakout trade. Calculate your position size based on the distance between your entry and stop loss. If your stop loss is 50 pips away and you want to risk $100, your position size should be calculated accordingly.
Take Profit Targets:
Set multiple take profit targets based on risk-reward ratios:
- Target 1 (1:1): Take profit equal to your risk. Secure some profit early.
- Target 2 (1:2): Take profit at double your risk. Let winners run.
- Target 3 (1:3 or higher): Let a portion run for maximum profit.
Risk-Reward Ratio:
Always aim for a minimum risk-reward ratio of 1:2. This means if you risk $100, you should target at least $200 in profit. This ensures that even if only 50% of your trades win, you'll still be profitable.
Common Mistakes to Avoid
Many traders fail at breakout trading because they make common mistakes. Learning to avoid these pitfalls will significantly improve your success rate.
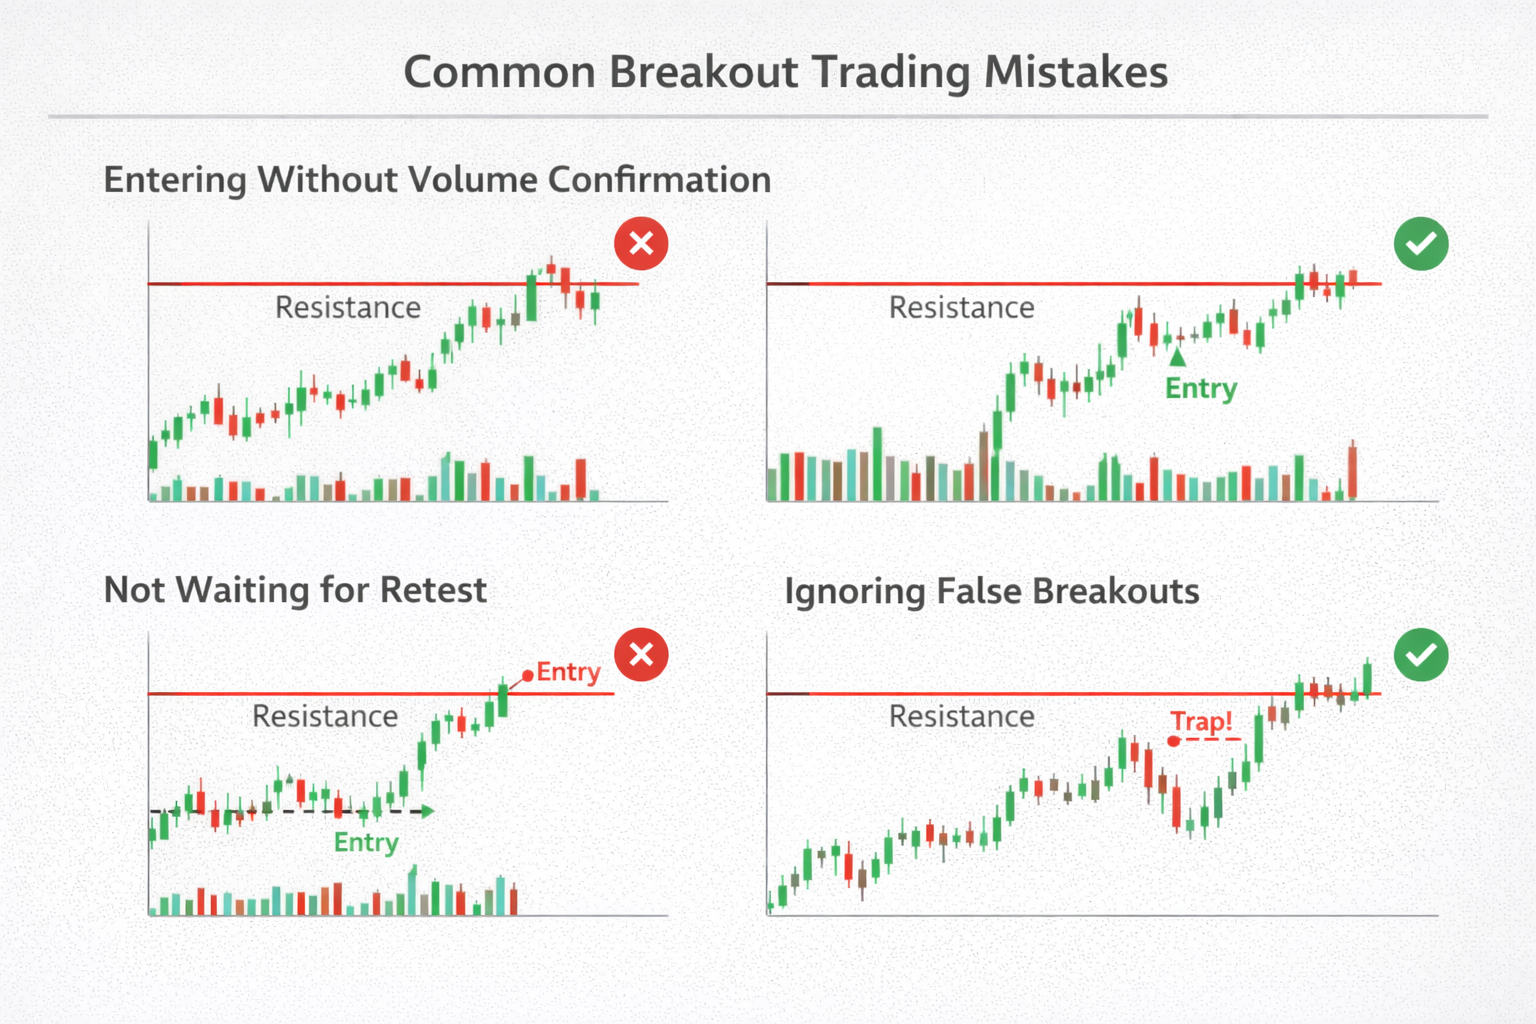
❌ Common Breakout Trading Mistakes
- 1. Entering Without Volume Confirmation: Breakouts without volume are often false. Always check volume before entering.
- 2. Trading Weak Support/Resistance: Only trade breakouts of strong, well-tested levels. Weak levels lead to false breakouts.
- 3. Ignoring the Larger Trend: Breakouts in the direction of the larger trend are more reliable. Don't fight the trend.
- 4. Not Using Stop Losses: False breakouts happen. Always use stop losses to limit losses.
- 5. Entering Too Early: Wait for a clear breakout with a strong candle, not just a wick through the level.
- 6. Overtrading: Not every consolidation leads to a good breakout. Be selective and wait for high-probability setups.
- 7. Ignoring Multiple Timeframes: Check higher timeframes to confirm the breakout aligns with the larger trend.
- 8. Poor Risk Management: Risking too much per trade or not using proper position sizing will destroy your account.
Getting Started with Breakout Trading
Breakout trading is a powerful strategy that can generate consistent profits when executed correctly. The key to success is patience, discipline, and proper risk management.
Your Action Plan:
- Practice Identifying Support/Resistance: Spend time on charts identifying strong support and resistance levels. Look for levels tested multiple times.
- Learn to Read Volume: Understand how volume confirms breakouts. Practice identifying high-volume vs. low-volume breakouts.
- Start with Paper Trading: Practice breakout trading in a demo account before risking real money.
- Focus on High-Probability Setups: Only trade breakouts that meet all your criteria: strong level, volume confirmation, trend alignment.
- Master Risk Management: Always use stop losses and proper position sizing. Never risk more than 1-2% per trade.
- Keep a Trading Journal: Record every breakout trade—what worked, what didn't, and why. Learn from your mistakes.
Key Takeaways
- Breakouts work best after extended consolidation periods with strong support/resistance levels
- Volume confirmation is essential—breakouts without volume are often false
- Multiple entry strategies exist—choose based on your risk tolerance
- Always use stop losses and aim for minimum 1:2 risk-reward ratios
- False breakouts are common—learn to identify and avoid them