What is Fibonacci Trading?
Fibonacci trading is a sophisticated technical analysis method that uses mathematical ratios derived from the Fibonacci sequence to identify potential support and resistance levels in financial markets. Named after Italian mathematician Leonardo Fibonacci, who introduced these numbers to Western Europe in the 13th century, these ratios have become one of the most powerful and widely-used tools in modern trading.
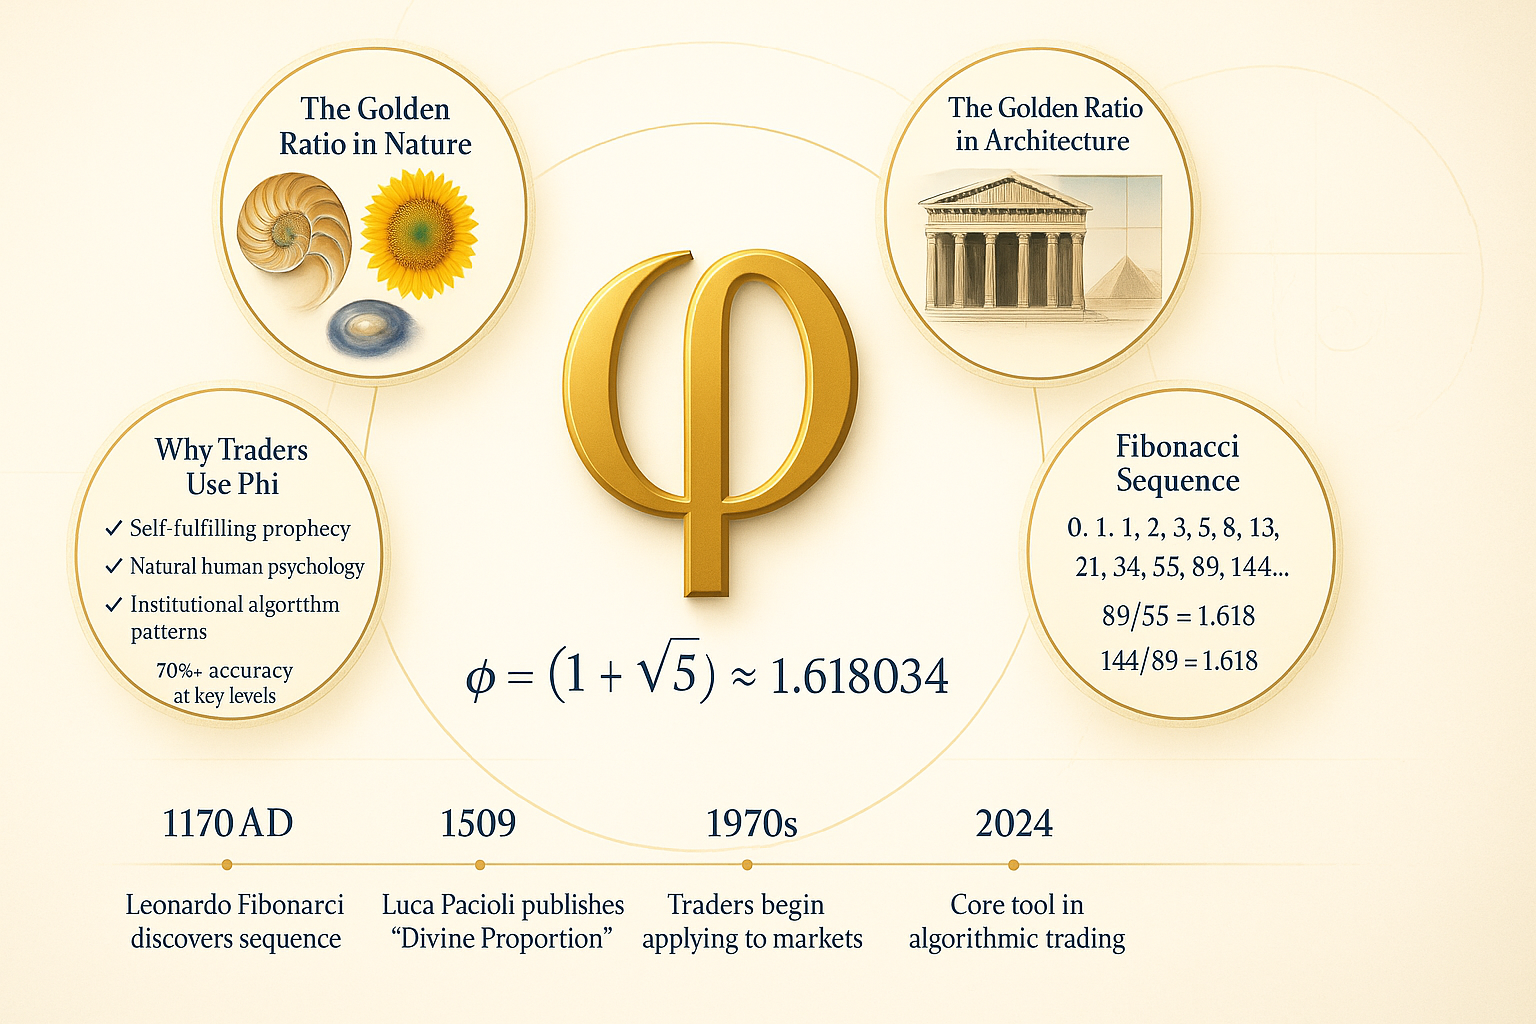
The Fibonacci sequence begins with 0 and 1, and each subsequent number is the sum of the previous two: 0, 1, 1, 2, 3, 5, 8, 13, 21, 34, 55, 89, 144, 233, and so on. What makes this sequence extraordinary is that as the numbers grow larger, the ratio between consecutive numbers approaches 1.618 (the golden ratio, represented by the Greek letter phi φ), and its inverse 0.618 (or 61.8% when expressed as a percentage).
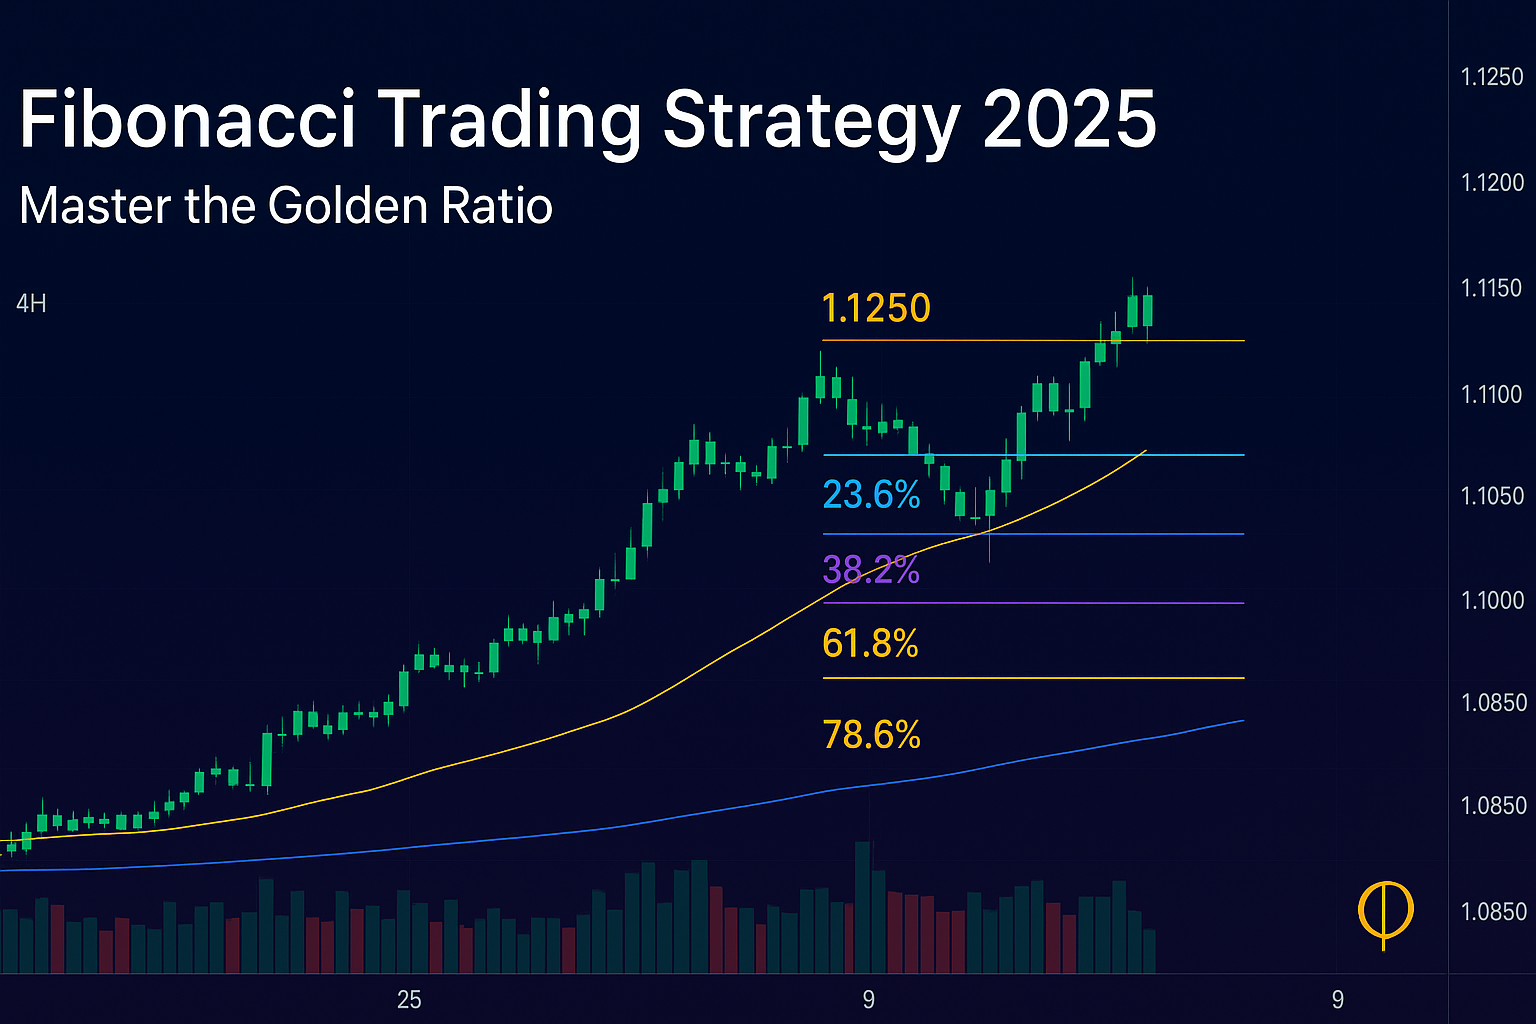
In trading, we convert these ratios into percentage levels: 23.6%, 38.2%, 50%, 61.8%, and 78.6%. These levels act as magnets for price during retracements and extensions. The most critical level is 61.8%—the golden ratio—where markets most commonly reverse before continuing their primary trend. Professional traders and institutional algorithms worldwide watch these levels, creating a self-fulfilling prophecy that makes them work with remarkable consistency.
Why Fibonacci Works in Trading: Markets are driven by human psychology, and humans naturally respond to these mathematical patterns. When millions of traders worldwide identify the same Fibonacci levels and place their orders at these points, they collectively create real support and resistance. Additionally, institutional trading algorithms are programmed to respect Fibonacci levels, further reinforcing their validity.
This comprehensive guide will teach you how to use Fibonacci retracements to find optimal entry points during pullbacks, and Fibonacci extensions to set scientific profit targets. You'll learn to combine Fibonacci with other technical analysis tools for high-probability setups with win rates of 70% or higher. Whether you're trading forex, stocks, cryptocurrencies, or commodities, Fibonacci analysis works across all markets and timeframes.
💡 Quick Fibonacci Facts
- ✓ The 61.8% level shows 65-75% accuracy across all markets
- ✓ Fibonacci works on all timeframes from 1-minute to monthly charts
- ✓ Banks and hedge funds program their algorithms to respect Fibonacci levels
- ✓ Combining Fibonacci with confluence increases win rate to 70-80%
- ✓ The golden ratio appears in nature, architecture, art, and market behavior
The Golden Ratio (Phi - φ)
The golden ratio, represented by the Greek letter phi (φ), is approximately 1.618033988749895... This mathematical constant has fascinated mathematicians, scientists, artists, and now traders for millennia. It's derived directly from the Fibonacci sequence: as the numbers grow larger, the ratio between consecutive numbers converges to phi.
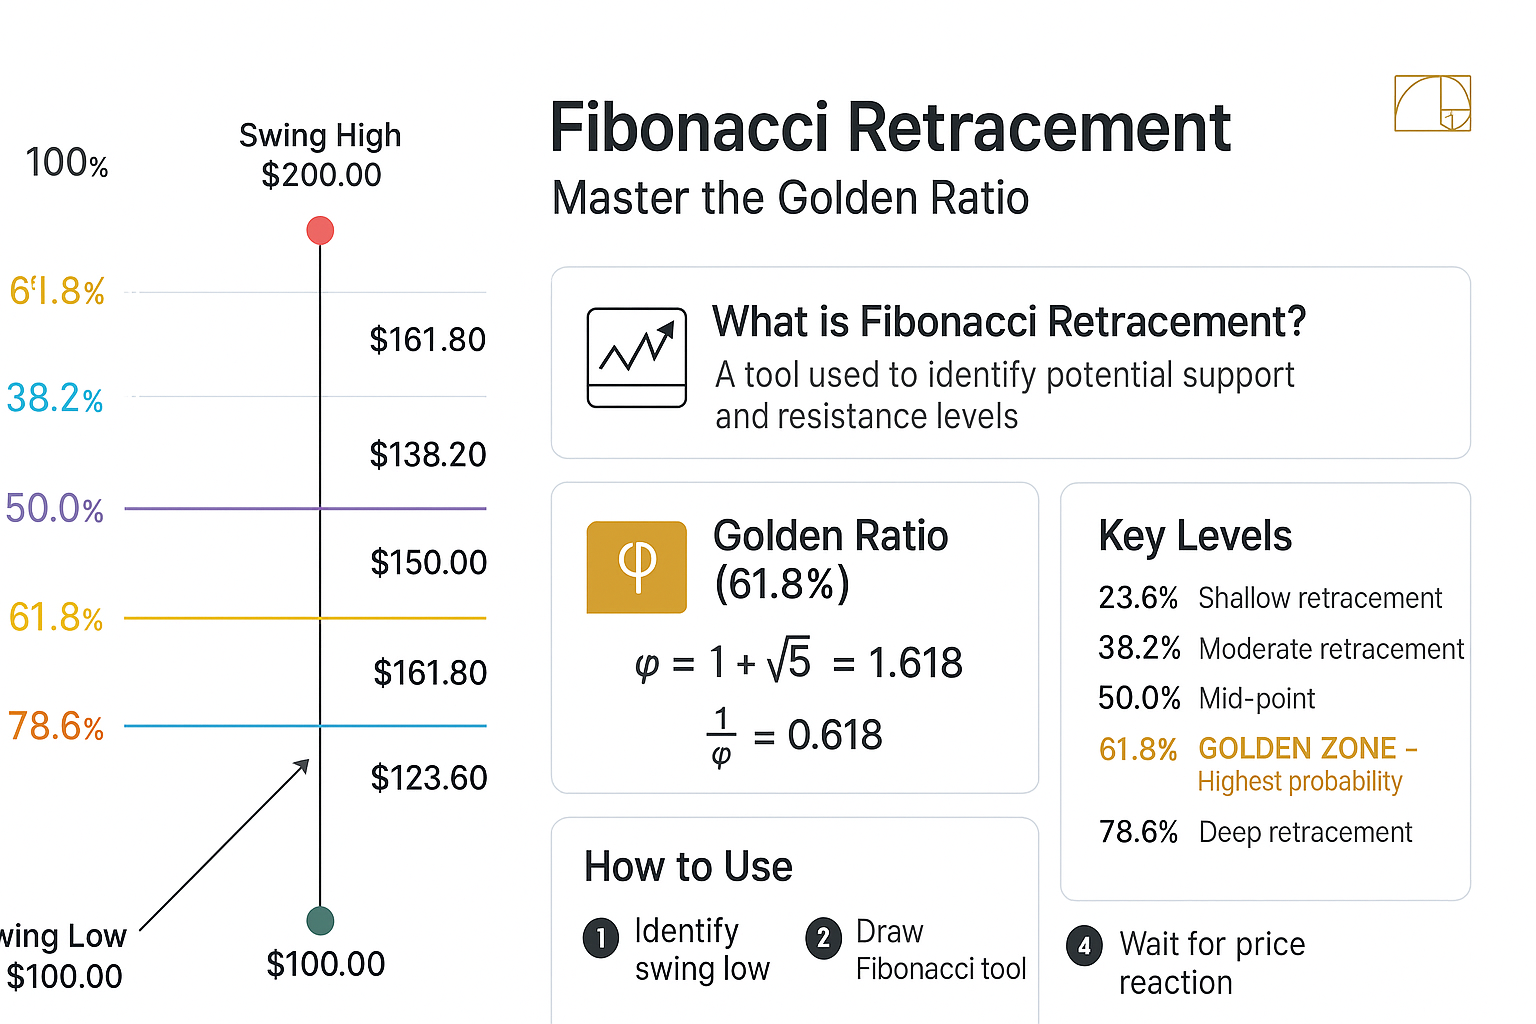
The Mathematical Foundation: φ = (1 + √5) / 2 ≈ 1.618. The reciprocal of phi is 0.618 (calculated as 1/1.618), which we express as 61.8% in trading. This ratio has a unique property: φ - 1 = 1/φ. This mathematical elegance translates into market behavior where price naturally gravitates toward these levels.
Where the Golden Ratio Appears:
- Nature: Nautilus shells spiral at the golden ratio, sunflower seed patterns follow Fibonacci spirals, galaxy arms spiral according to phi, and even human body proportions (navel to feet vs. head to navel) approximate 1.618
- Architecture: The Great Pyramid of Giza, the Parthenon, and modern buildings use golden ratio proportions for aesthetic appeal
- Art: Leonardo da Vinci used phi in the Mona Lisa and Vitruvian Man. Artists through history have used this ratio for "perfect" composition
- Music: Musical scales and harmonies often follow Fibonacci relationships
- Biology: DNA molecules measure 34 angstroms by 21 angstroms (both Fibonacci numbers), creating a golden ratio
The Golden Ratio in Financial Markets: When applied to trading, the golden ratio becomes 0.618 or 61.8%. This is THE most important Fibonacci level. Here's why it works:
- Natural Market Rhythm: Markets move in waves—impulse moves followed by corrective retracements. The 61.8% retracement represents a healthy pullback that doesn't invalidate the trend
- Institutional Behavior: Banks, hedge funds, and institutional traders use sophisticated algorithms programmed to identify and respect the 61.8% level. When billions of dollars in institutional orders cluster at this level, it becomes real support/resistance
- Self-Fulfilling Prophecy: Because millions of retail and professional traders worldwide watch the 61.8% level, their collective buying and selling at this point creates actual price action reactions
- Psychological Significance: The 61.8% level represents the sweet spot where late-trend participants have been shaken out, but the main trend remains intact. It's deep enough to scare weak hands but not so deep that it invalidates the trend
Statistical Evidence: Academic studies and trading backtests consistently show that:
- Markets retrace to 61.8% in approximately 70% of significant trends
- When combined with other confluence factors (support/resistance, moving averages), accuracy increases to 75-80%
- The 61.8% level provides better risk-reward ratios than other common support/resistance methods
- Across all markets (forex, stocks, crypto, commodities) and all timeframes, the 61.8% level consistently outperforms random entry points
Understanding why the golden ratio works is crucial for trading with confidence. It's not magic or mysticism—it's a combination of mathematics, mass psychology, institutional behavior, and centuries of market patterns. When you trade the 61.8% level, you're aligning yourself with the natural rhythm of markets and the behavior of smart money.
Fibonacci Retracement Levels Explained
Fibonacci retracement levels are horizontal lines that indicate where support and resistance are likely to occur during pullbacks within a trend. These levels are calculated by taking two extreme points on a chart—a swing low and a swing high—and dividing the vertical distance by key Fibonacci ratios. The retracement levels represent how far price has "retraced" or pulled back from its recent move.
The Five Key Fibonacci Retracement Levels:
Shallow Retracement Level
The shallowest retracement level. In very strong trends, price may only pull back to this level before resuming. This level is often skipped entirely in powerful momentum moves. Best used for aggressive entries in strong trends confirmed by higher timeframes. Success rate: 45-50% in isolation.
Moderate Retracement Level
A moderate pullback level that works well in healthy, sustained trends. Price action at this level often shows quick reversals with strong momentum. Good for aggressive entries when combined with bullish/bearish reversal patterns. Many professional traders who missed the initial move enter here. Success rate: 55-60% with confirmation.
Mid-Point Level (Psychological)
Not technically a Fibonacci ratio, but included because it represents a psychological level—the exact midpoint of the move. Markets often respect round numbers and the 50% level combines this psychology with Fibonacci analysis. Dow Theory identifies 50% as a typical retracement depth. Success rate: 60-65% in trending markets.
⭐ THE GOLDEN RATIO - Most Important Level
This is THE level where professional traders focus their attention. The 61.8% retracement represents the golden ratio and is statistically the most reliable level. Price reversals at this level are strong and sustainable. This is where institutional algorithms have the most buy/sell orders programmed. When combined with other confluence factors, win rates reach 70-75%. This should be your primary level to watch.
Deep Retracement Level
The deepest retracement level before trend invalidation. This represents a "last chance" entry point. If price breaks below this level (in uptrends) or above it (in downtrends), the trend may be reversing rather than just retracing. The 78.6% level combined with 61.8% creates the "Golden Pocket"—the optimal entry zone. Success rate: 65-70% when used as final support before invalidation.
How to Draw Fibonacci Retracement (Step-by-Step):
- Identify the Trend: First, determine whether you're in an uptrend (higher highs and higher lows) or downtrend (lower highs and lower lows). This is critical because drawing direction changes based on trend.
- Find Significant Swing Points: Locate the most recent major swing low and swing high. These should be obvious turning points visible to all traders, not minor fluctuations. Typically, these swings span 50-100+ candles.
- Draw in Correct Direction:
- For Uptrends: Click first on the swing LOW (bottom), then drag to the swing HIGH (top)
- For Downtrends: Click first on the swing HIGH (top), then drag to the swing LOW (bottom)
- Review the Levels: Your platform automatically displays horizontal lines at 0%, 23.6%, 38.2%, 50%, 61.8%, 78.6%, and 100%. The 0% and 100% represent your swing points.
- Mark the Golden Pocket: Draw a rectangle or shaded zone between 61.8% and 78.6%. This is your primary trading zone.
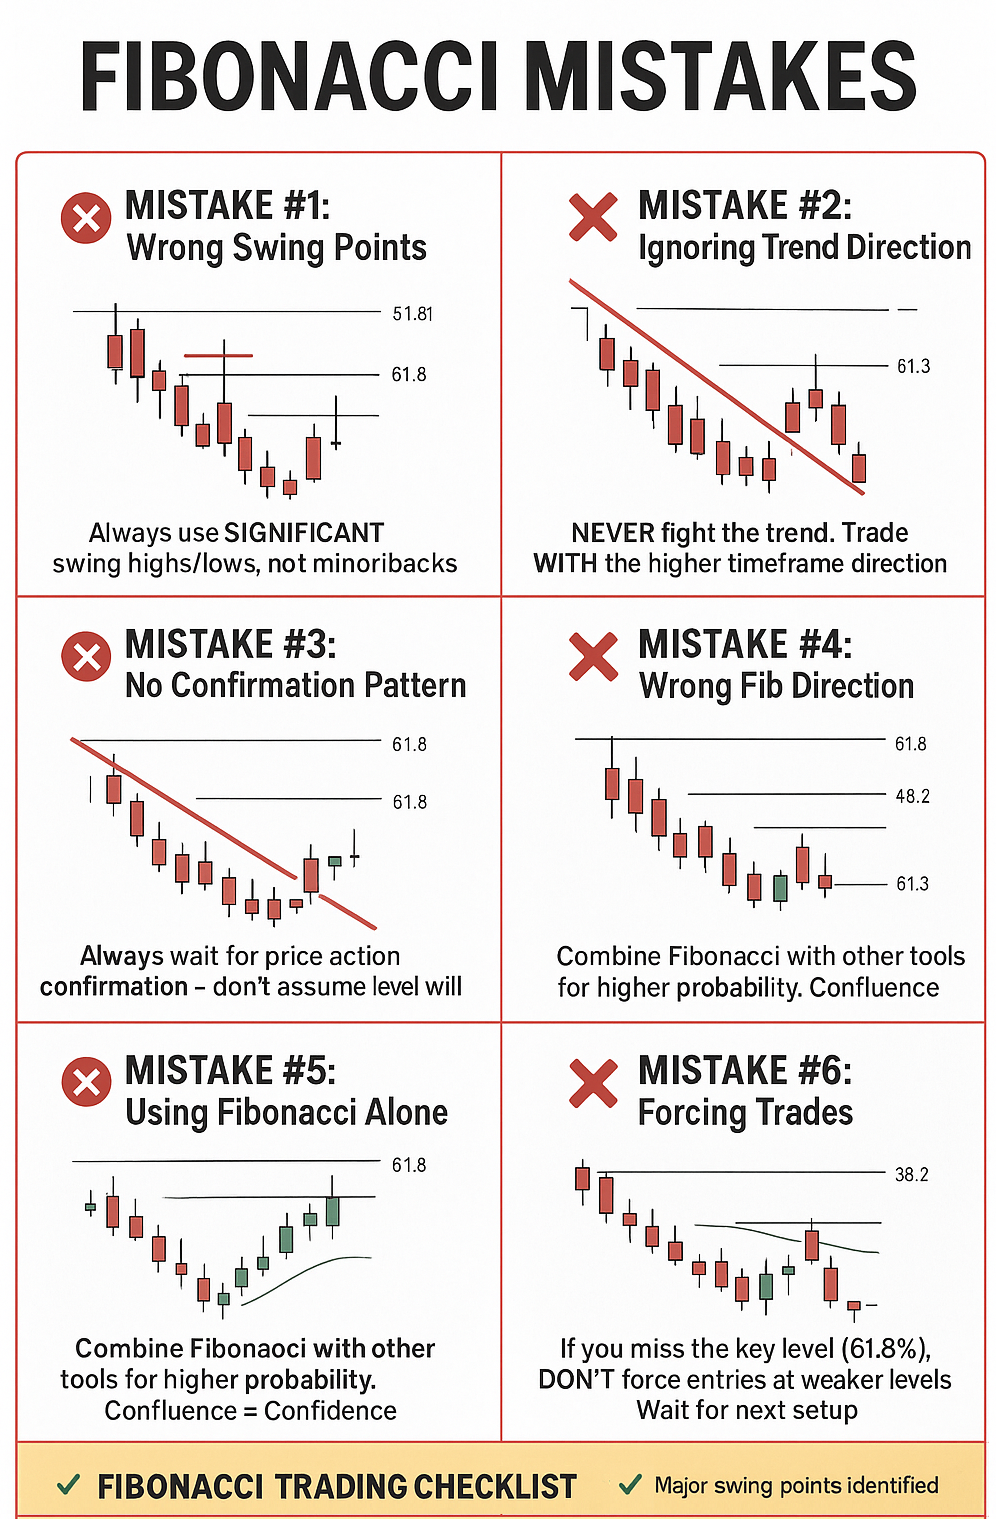
Common Mistakes When Drawing Fibonacci:
- ❌ Using minor swings instead of major trend swings (must span 50+ candles minimum)
- ❌ Drawing in the wrong direction (uptrend should be low to high, not high to low)
- ❌ Constantly redrawing on every small pullback (stick with major swings)
- ❌ Ignoring the higher timeframe trend when selecting swing points
- ❌ Measuring from wick to wick inconsistently (choose body-to-body or wick-to-wick and be consistent)
Professional Tips:
- ✓ Draw Fibonacci on multiple timeframes (Daily, 4H, 1H) to find where levels cluster
- ✓ The more times a Fibonacci level has been respected historically, the stronger it becomes
- ✓ Always wait for price action confirmation at Fibonacci levels—never enter blindly
- ✓ Use Fibonacci as one tool among several—combine with support/resistance, moving averages, and volume
- ✓ In strong trends, price often reverses between 38.2% and 50%; in weaker trends, expect 61.8% or deeper
The Golden Pocket (61.8% - 78.6%)
Professional traders focus on the zone between 61.8% and 78.6%, called the "Golden Pocket." This area offers the highest probability reversals and optimal risk-reward ratios.
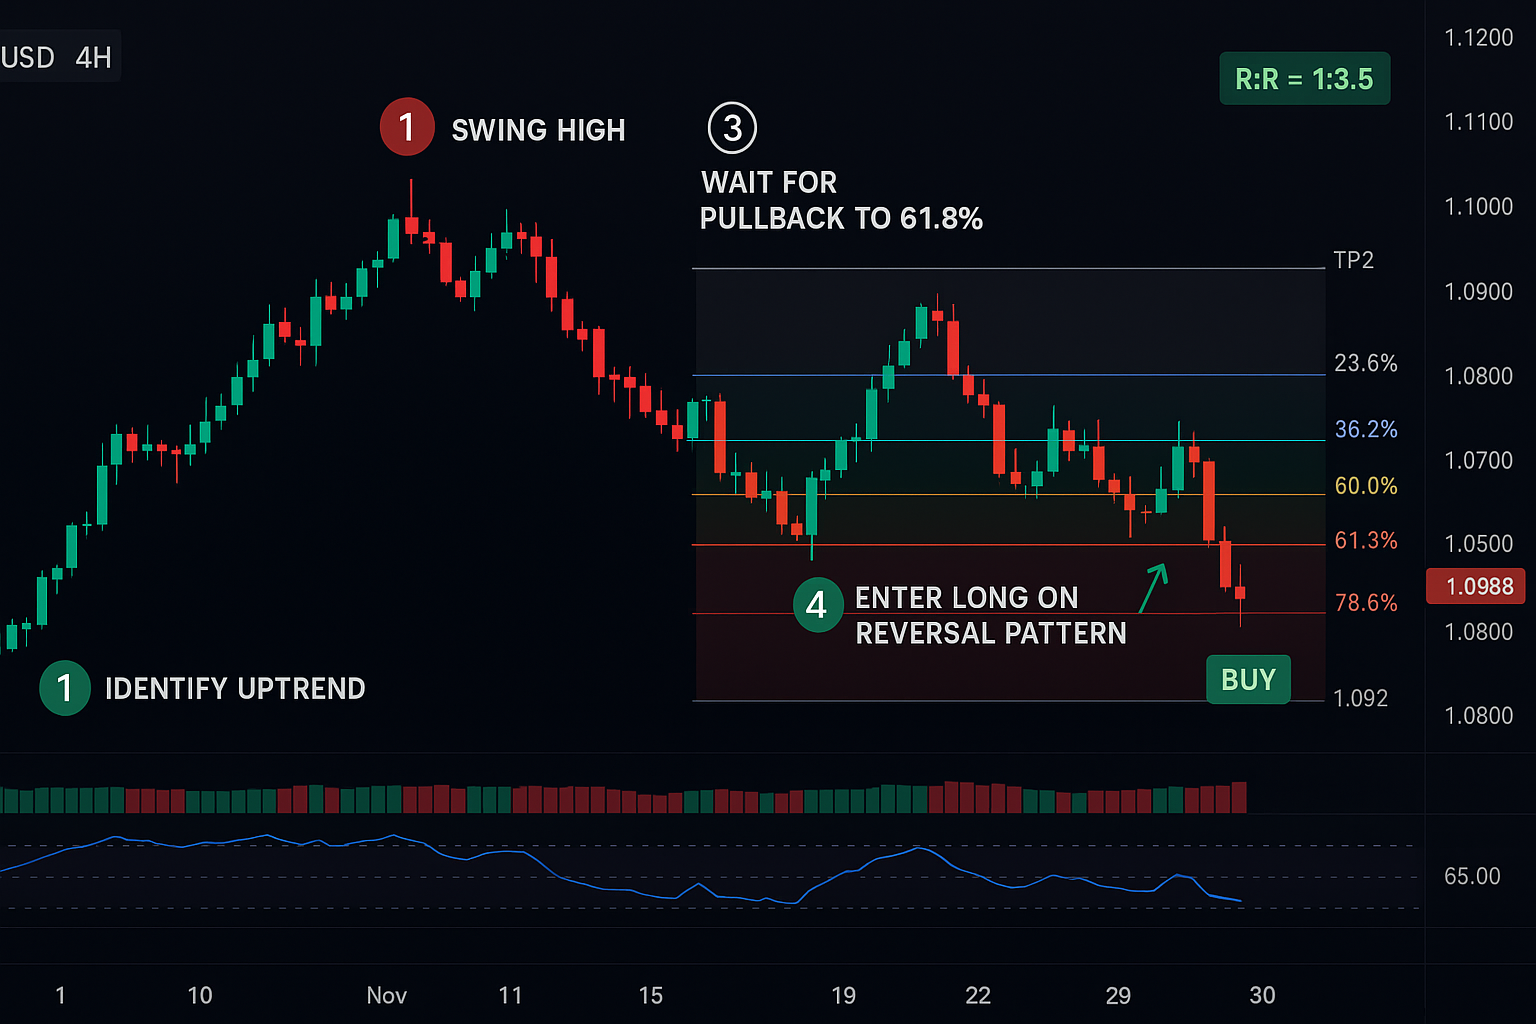
Trading Fibonacci in Uptrends
Trading Fibonacci retracements in uptrends is one of the highest probability strategies in all of technical analysis. The concept is simple but powerful: wait for price to pull back to key Fibonacci levels during an established uptrend, then enter when you see confirmation that buyers are stepping back in. This allows you to enter trends at better prices than breakout traders, with defined risk and excellent reward potential.
Complete Step-by-Step Uptrend Fibonacci Strategy:
Confirm the Uptrend (Multiple Timeframes)
Before trading any pullback, confirm you're in a genuine uptrend:
- Check the Daily and Weekly charts first—are they bullish?
- Identify higher highs and higher lows on your trading timeframe
- Price should be above key moving averages (50 EMA and 200 EMA)
- Volume should be increasing on up-moves and decreasing on pullbacks
- Critical Rule: Never fight the higher timeframe trend. If Daily is bearish, don't take long trades on lower timeframes.
Identify Major Swing Low and Swing High
Find the clear, obvious swing points:
- Swing Low: The point where the current uptrend rally began. This should be a clear bottom that everyone can see.
- Swing High: The recent peak where price has started to pull back from.
- Time Span: These swings should be separated by at least 50-100 candles (on your trading timeframe).
- Significance: The larger the move between swing points, the more reliable the Fibonacci levels will be.
- Visibility: If you have to zoom in to see the swings, they're not significant enough. Major swings are obvious at first glance.
Draw Fibonacci from Swing Low to Swing High
Apply the Fibonacci retracement tool correctly:
- Click first on the swing LOW (where uptrend started)
- Drag to the swing HIGH (recent peak)
- Your platform displays levels: 23.6%, 38.2%, 50%, 61.8%, 78.6%
- Draw a rectangle or shaded box around the 61.8%-78.6% zone (Golden Pocket)
- This Golden Pocket is where you want price to retrace to
Check for Confluence Factors
While waiting for price to retrace, identify what else is at the Golden Pocket:
- Is there historical support/resistance at this level?
- Does the 50 EMA or 200 EMA intersect near 61.8%?
- Is there an ascending trend line that touches the Golden Pocket?
- Are there pivot points (daily, weekly) at this level?
- Goal: Find at least 3 confluence factors. More confluence = higher probability.
Be Patient - Wait for Pullback to Golden Pocket
This is where discipline separates professionals from amateurs:
- Do NOT force entries at 23.6% or 38.2% just because you're impatient
- Wait for price to reach the 61.8%-78.6% Golden Pocket zone
- This may take hours, days, or even weeks depending on your timeframe
- Set price alerts at 62% and 78% so you don't have to watch constantly
- Remember: If price doesn't reach your level, that's fine. There will always be another trade. Don't chase.
⭐ Wait for Confirmation Pattern (CRITICAL)
This step is what separates winning traders from losing traders. NEVER enter blindly at a Fibonacci level. Wait for these patterns:
- Bullish Pin Bar: Long lower wick (rejection), small body at top. Shows sellers tried to push lower but buyers overwhelmed them.
- Bullish Engulfing: Large green candle that completely engulfs the previous red candle. Powerful reversal signal.
- Bullish Order Block (ICT Method): The last red candle before price reverses upward. This represents where institutions placed their buy orders.
- Double Bottom: Price tests the Fibonacci level twice, forming a "W" pattern before reversing.
- Morning Star Pattern: Three-candle pattern: down candle, small indecision candle, strong up candle.
- Volume Confirmation: Whatever pattern forms, it should have increasing volume showing real buying pressure.
⚠️ Without confirmation, Fibonacci levels are just lines on a chart. Wait for the pattern!
Enter the Trade with Proper Risk Management
Once your confirmation candle closes, execute your trade:
- Entry Price: Enter at the close of the confirmation candle, or on the open of the next candle
- Stop Loss Placement:
- Conservative: 10-20 pips below the 78.6% level
- Standard: Below the low of your confirmation pattern
- Aggressive: Tight stop below the 61.8% level (only if you have strong confluence)
- Position Size: Risk only 1-2% of your account on this single trade. No exceptions.
- Example: Entry at 1.0950, stop loss at 1.0920 = 30 pips risk. If you have a $10,000 account and risk 1% ($100), position size = $100 ÷ 30 pips = $3.33 per pip.
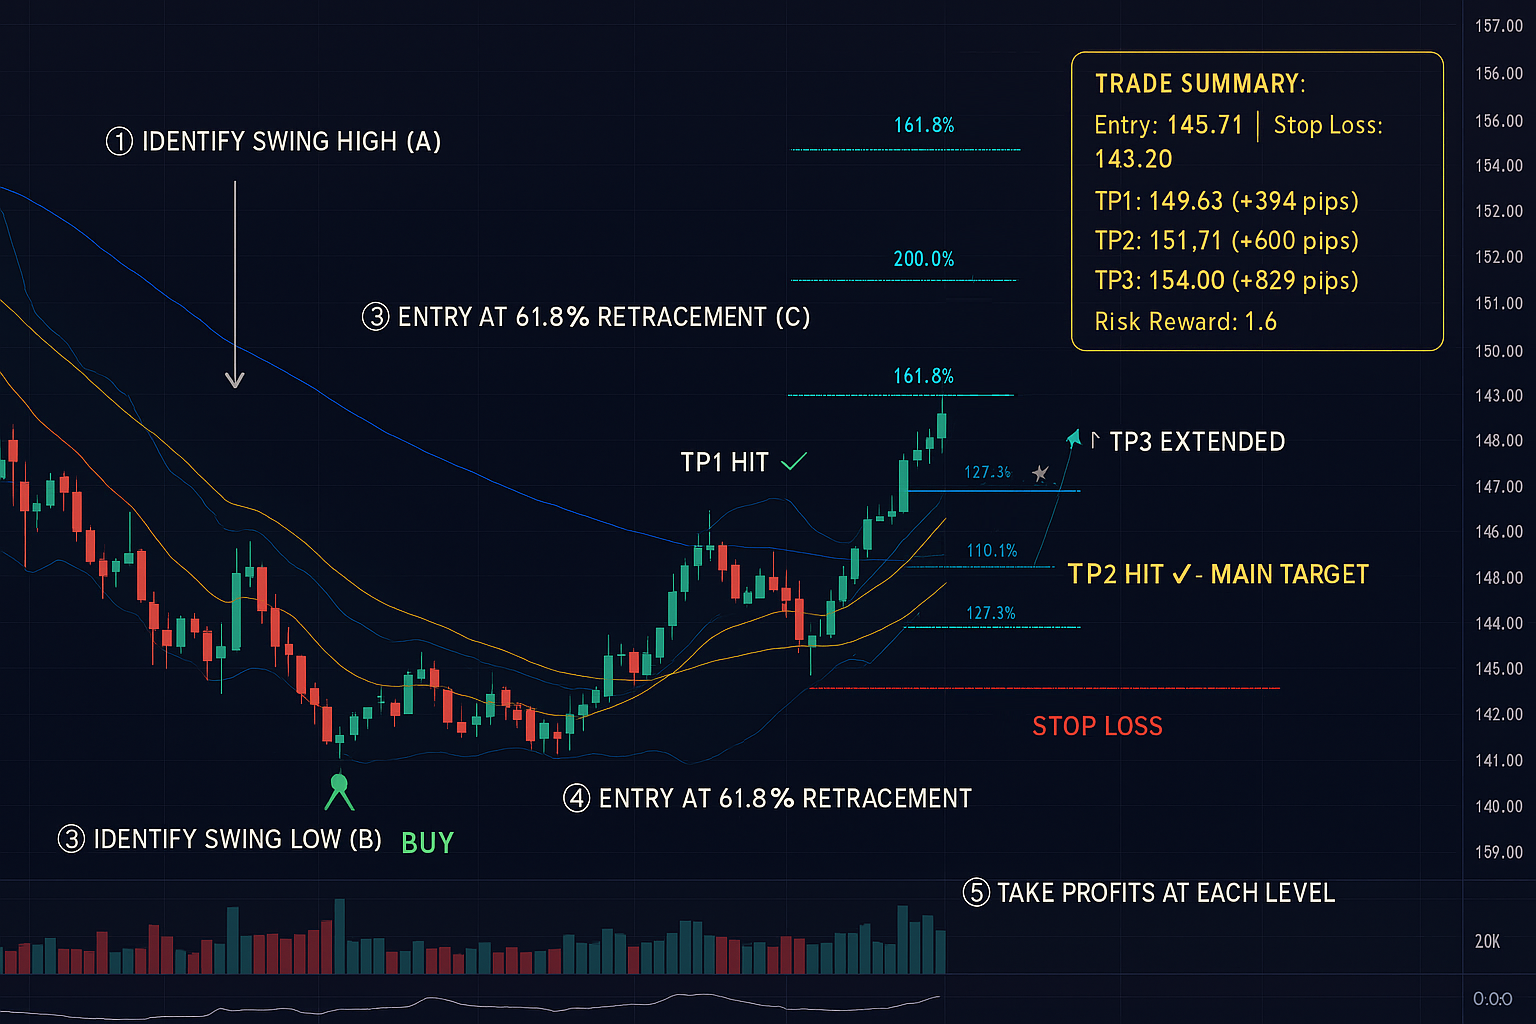
Set Profit Targets Using Extensions
Use Fibonacci extensions to set scientific profit targets:
- Target 1 (Conservative): Previous swing high (the 100% level). This guarantees at least 1:1.5 risk-reward.
- Target 2 (Standard): 127.2% Fibonacci extension. Take 1/3 of your position here, move stop loss to breakeven.
- Target 3 (Aggressive): 161.8% Fibonacci extension (Golden Extension). Take another 1/3 here.
- Target 4 (Runner): Let final 1/3 run with trailing stop loss to 200% or 261.8% extension.
- Example: Entry at 1.0950, SL at 1.0920 (30 pips risk). TP1 at 1.1100 (150 pips = 1:5 R:R), TP2 at 1.1195 (245 pips = 1:8 R:R).
Real Trading Example - EUR/USD: Daily chart shows strong uptrend. Price rallies from 1.0500 (swing low) to 1.1200 (swing high) over 3 months. You draw Fibonacci and identify 61.8% at 1.0767. This level also coincides with previous resistance (now support) and the 200-day EMA. Price pulls back to 1.0775, forms a bullish pin bar with long lower wick on heavy volume. You enter long at 1.0780 (pin bar close), place stop loss at 1.0740 (below 78.6% and pin bar low) = 40 pips risk. Your first target is previous high at 1.1200 (420 pips = 1:10.5 R:R). Your second target is 127.2% extension at 1.1350 (570 pips = 1:14 R:R). This is the power of Fibonacci—small risk, massive reward potential.
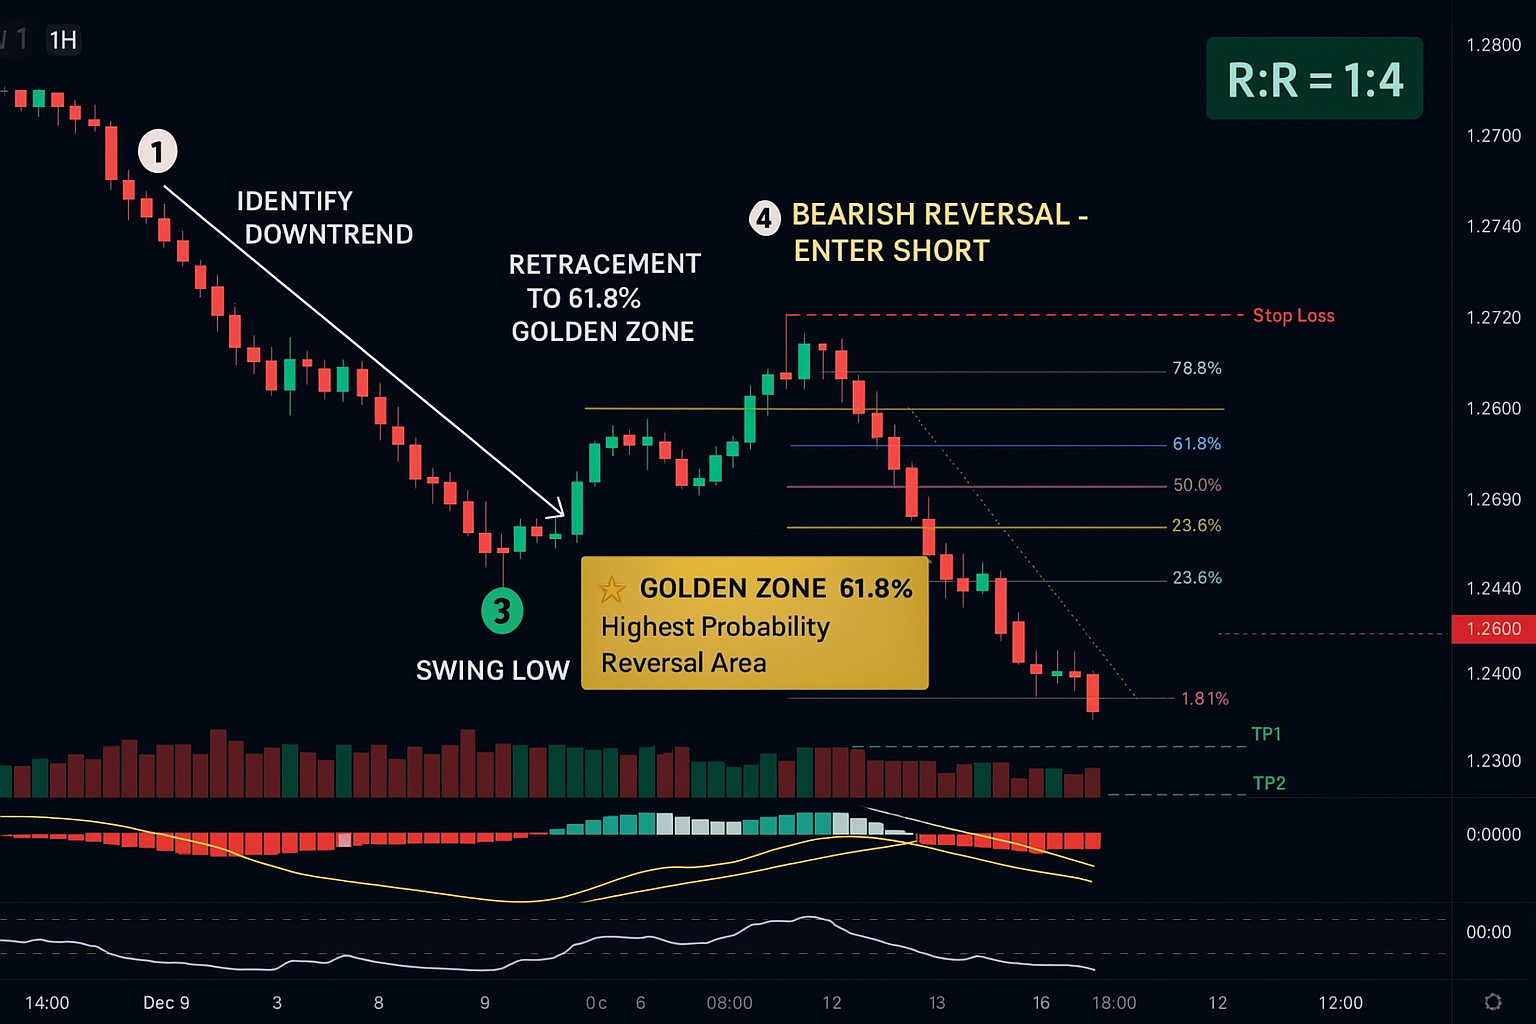
Trading Fibonacci in Downtrends
In downtrends, draw Fibonacci from swing HIGH to swing LOW. Look for bearish reversal patterns at 61.8% as price retraces upward.
Fibonacci Extension Levels
Extensions (127.2%, 161.8%, 200%, 261.8%) project profit targets beyond the swing high. The 161.8% golden extension is the most common target.
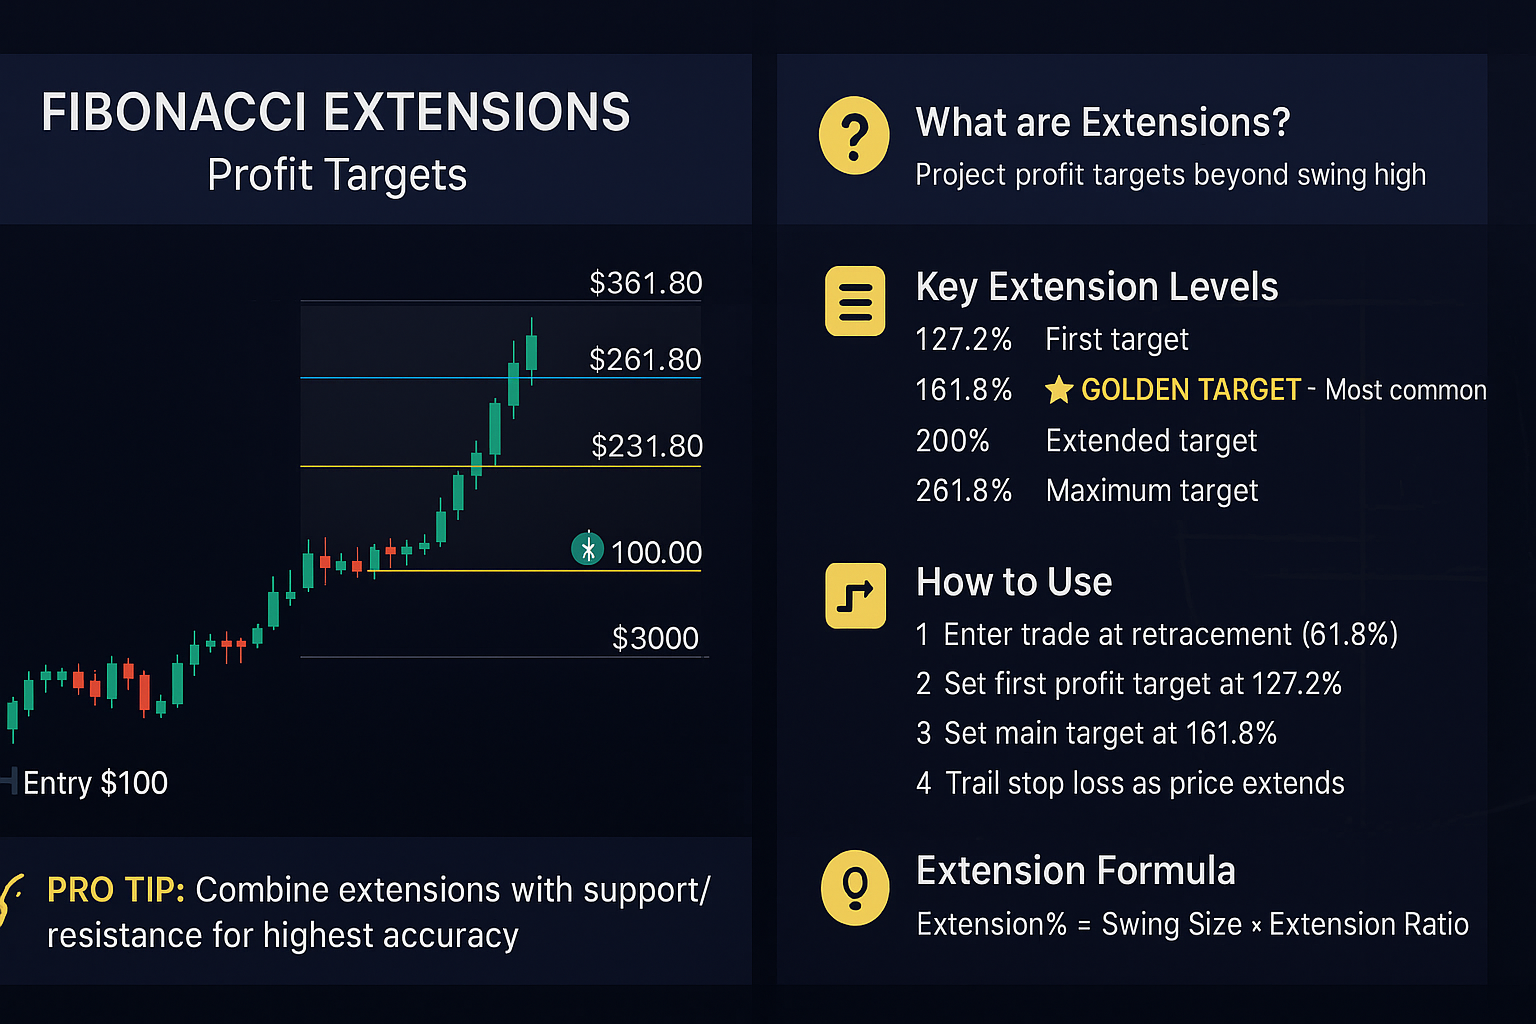
Using Extensions as Profit Targets
Scale out at each extension: Take 1/3 at 127.2%, another 1/3 at 161.8%, and let the final portion run to 200%+ with trailing stops.
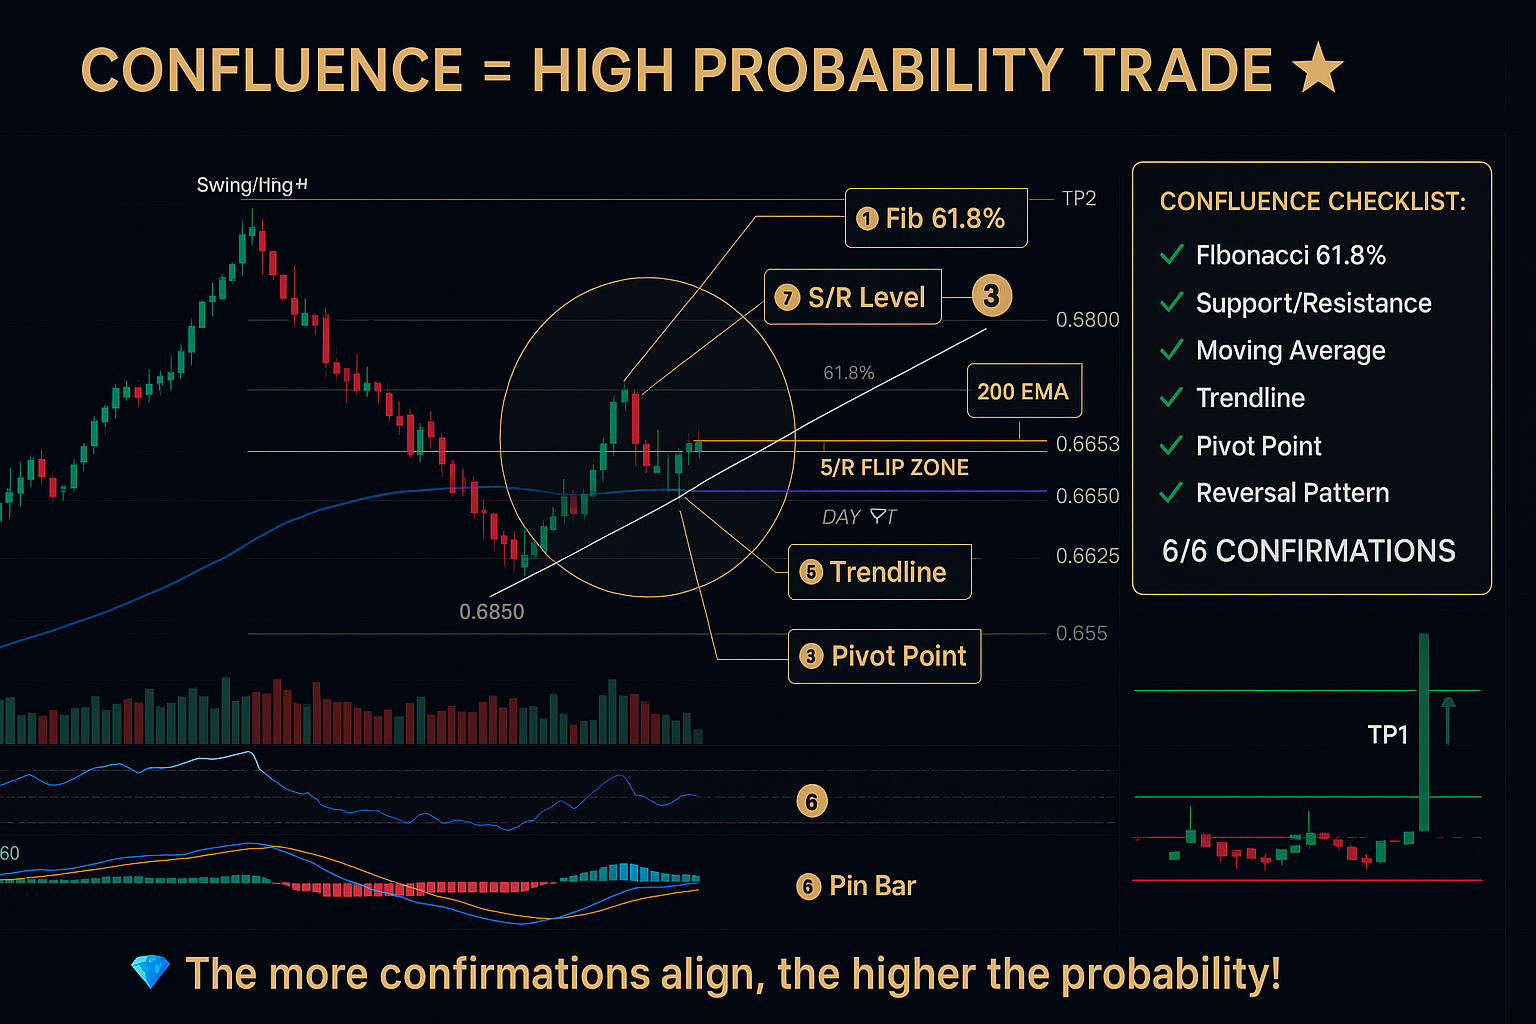
Fibonacci + Price Action Confluence
The most powerful setups combine Fibonacci with support/resistance, moving averages, trend lines, and reversal patterns. Aim for 3+ confluence factors.
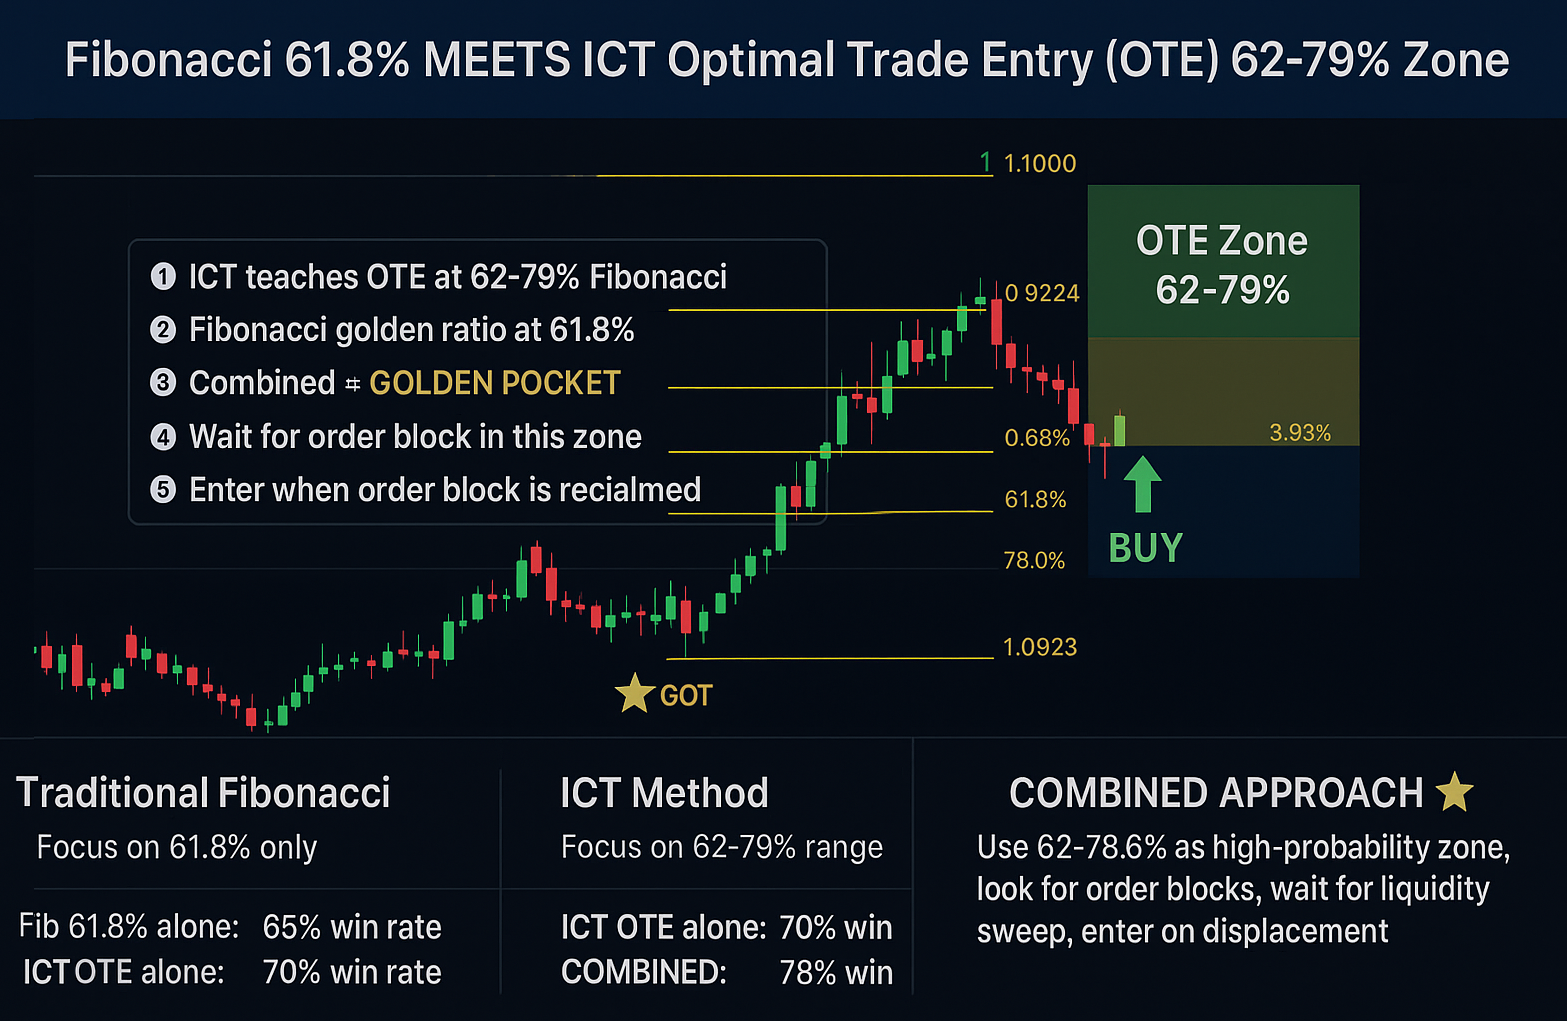
Fibonacci + ICT Optimal Trade Entry (OTE)
ICT's Optimal Trade Entry (62-79%) aligns perfectly with Fibonacci's Golden Pocket (61.8-78.6%). Combine with order blocks for 75-80% win rate.
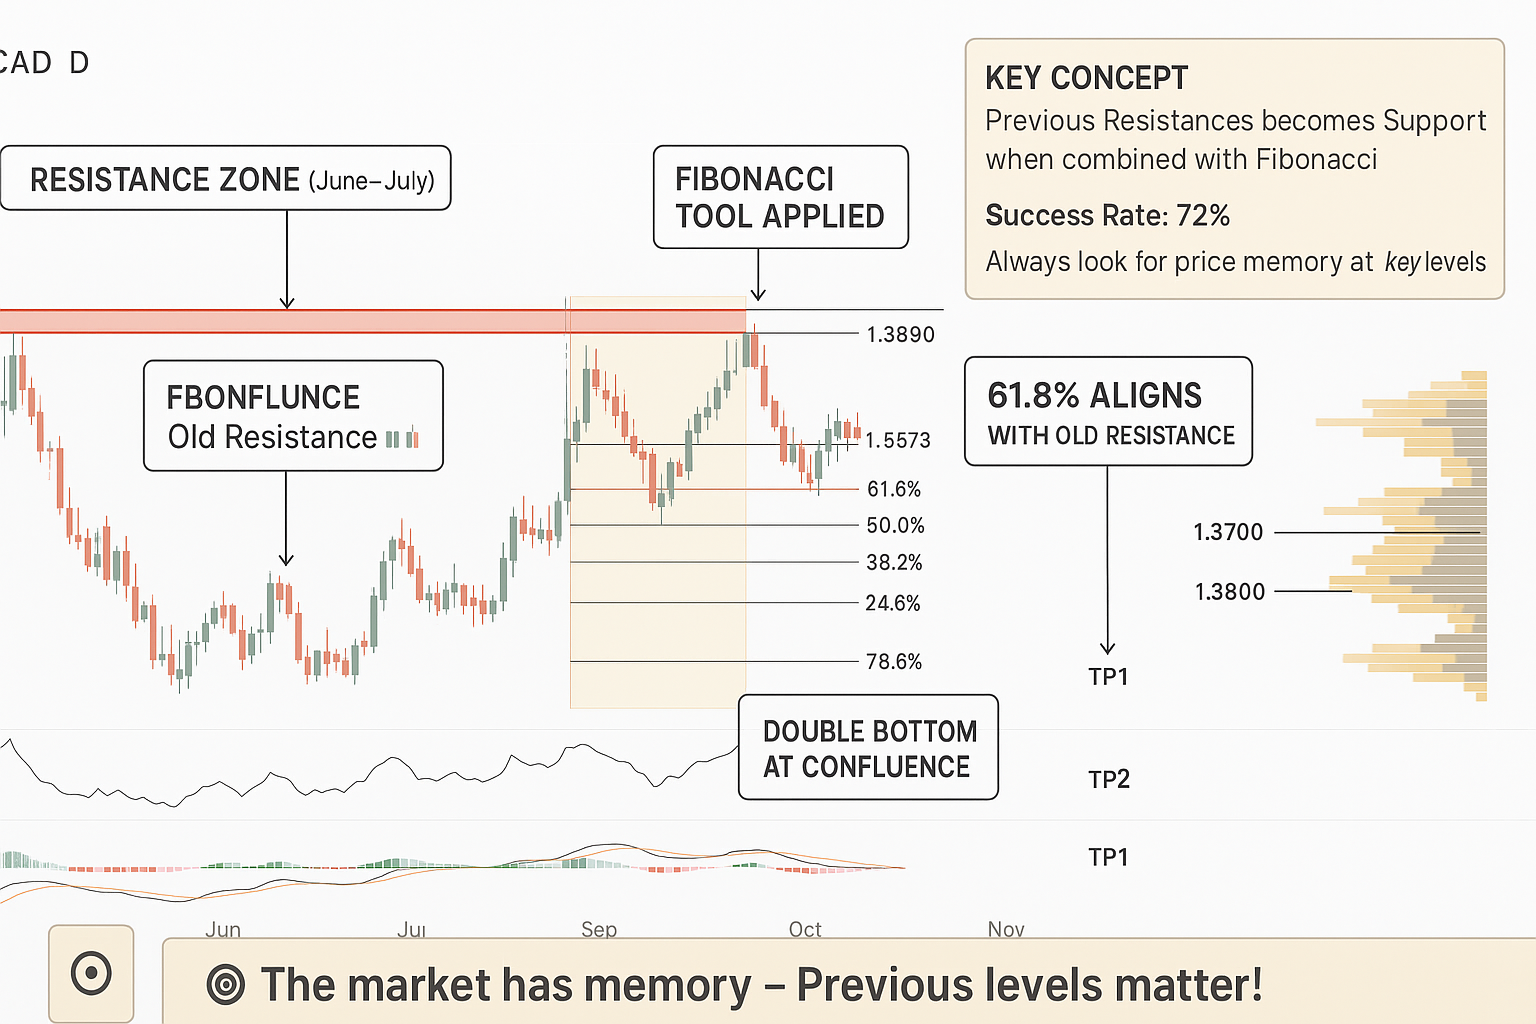
Fibonacci + Support/Resistance Zones
When Fibonacci 61.8% aligns with historical support/resistance, win rates jump to 72-78%. Markets have memory—previous levels matter.
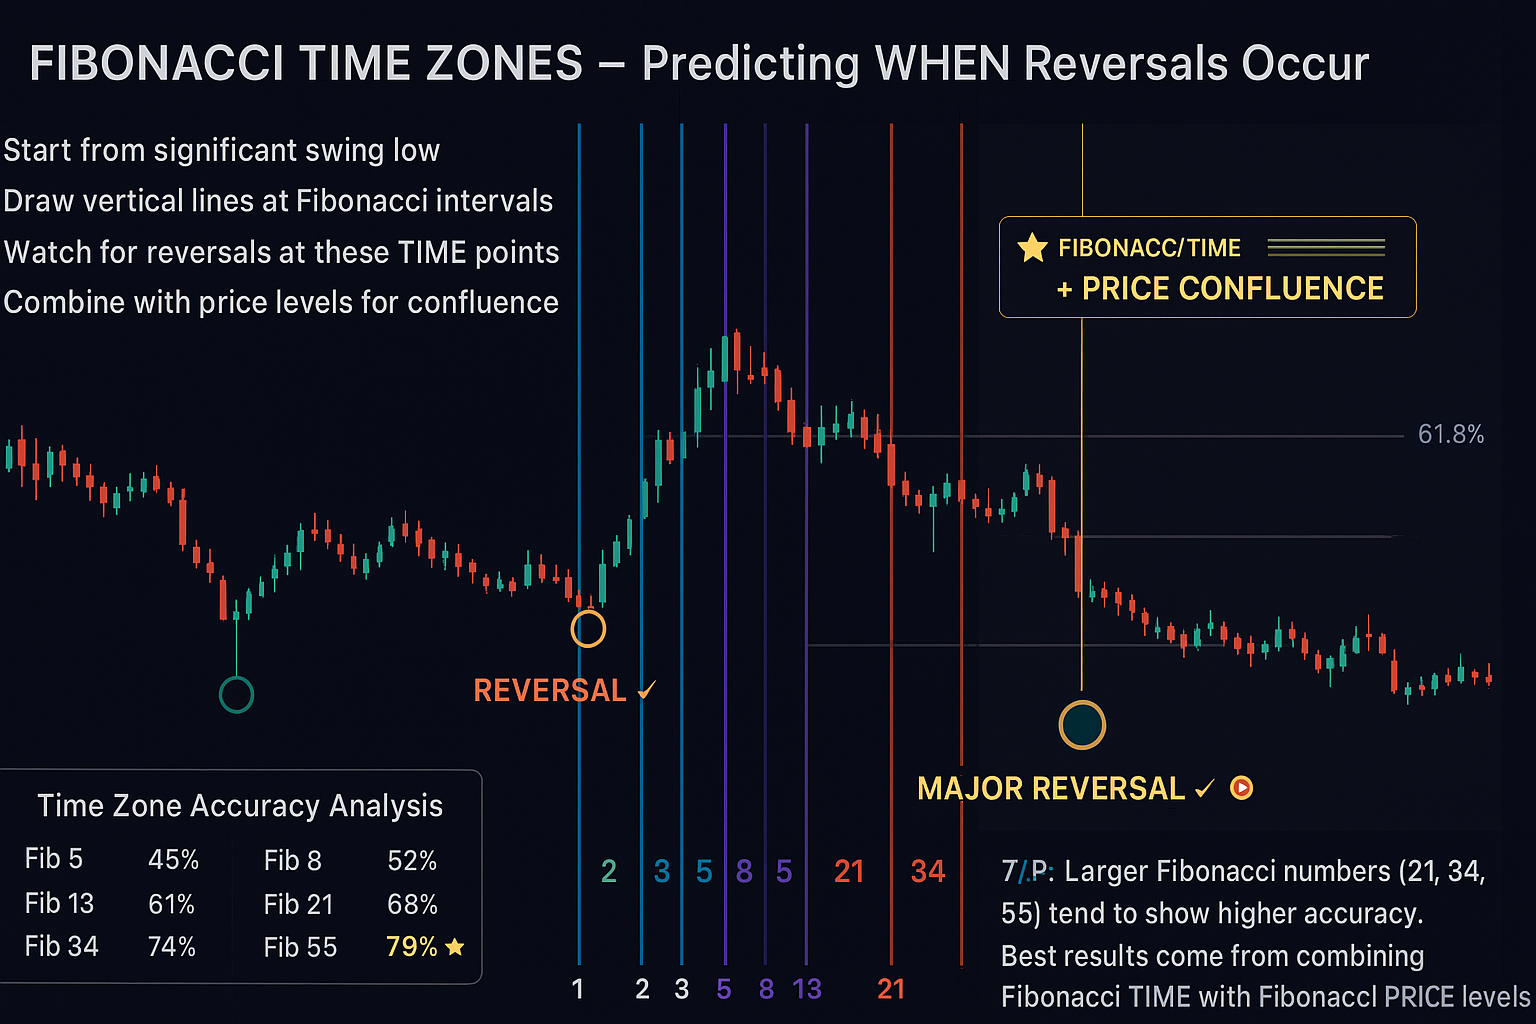
Fibonacci Time Zones
Fibonacci time zones predict WHEN reversals might occur using vertical lines at Fibonacci intervals (21, 34, 55, 89 bars). Combine with price levels for powerful confluence.
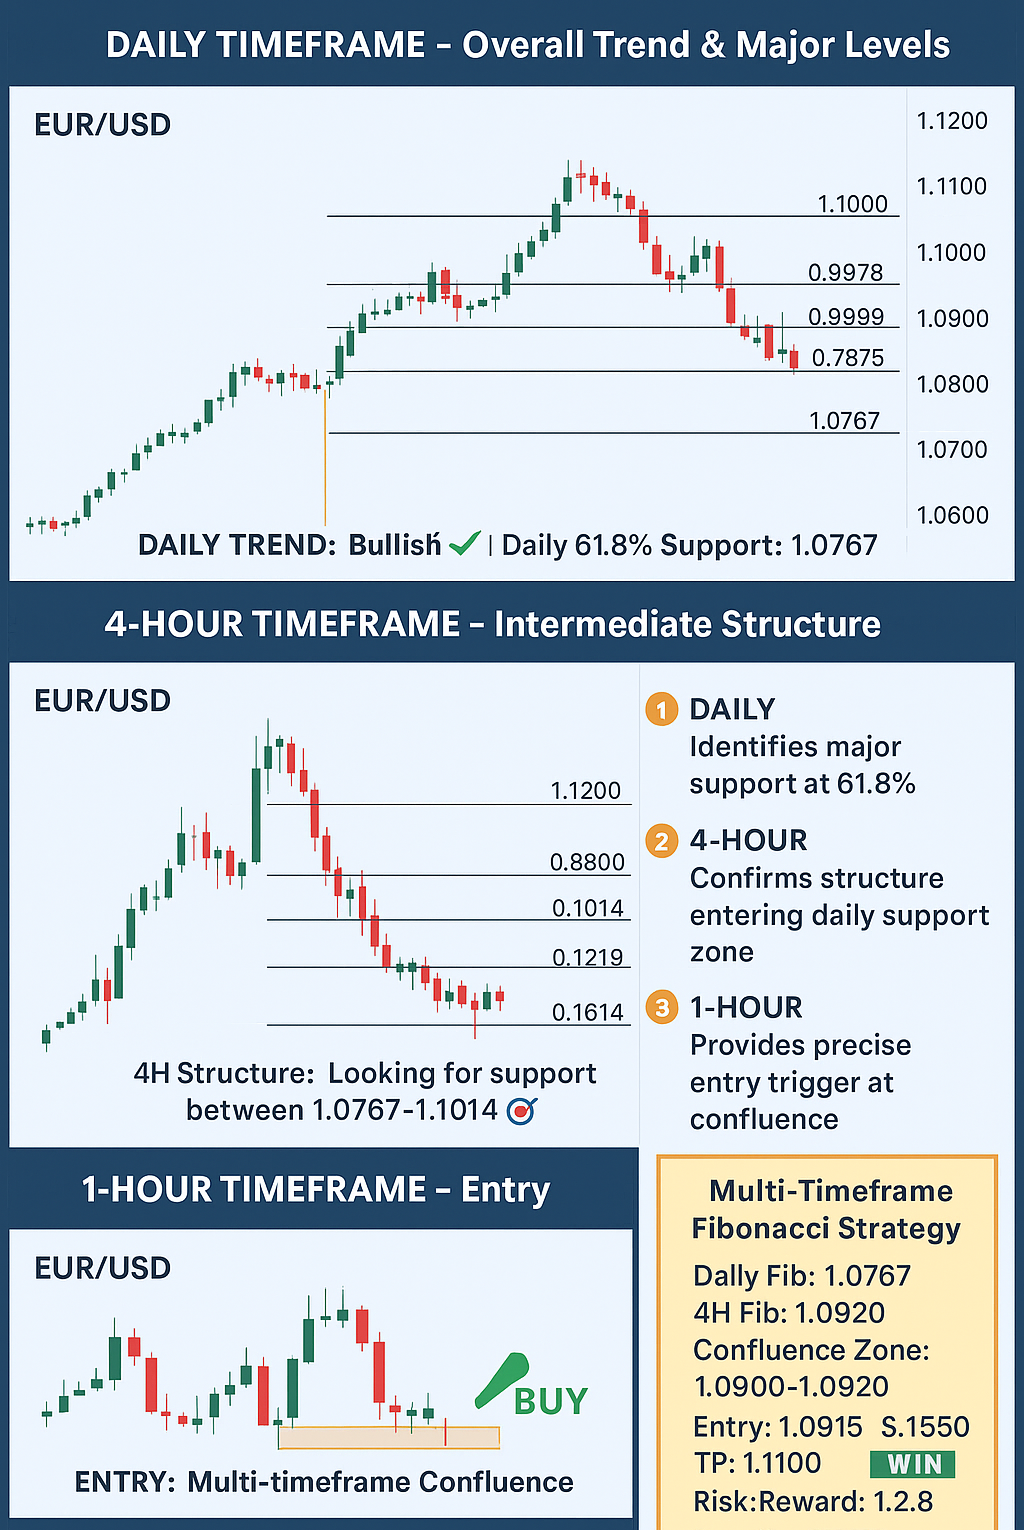
Multi-Timeframe Fibonacci Analysis
Analyze Fibonacci across Daily, 4H, and 1H timeframes. When levels from multiple timeframes align, win rates reach 70-80% vs 60-65% single timeframe.
Common Fibonacci Trading Mistakes to Avoid
Avoid these 6 deadly mistakes: wrong swing points, ignoring trend, no confirmation, wrong direction, using Fibonacci alone, and forcing trades at weak levels.
✅ Pre-Trade Fibonacci Checklist
- ☐ Major swing points identified (50+ candles)
- ☐ Trading WITH the higher timeframe trend
- ☐ Confirmation pattern formed at Fibonacci level
- ☐ At least 3 confluence factors present
- ☐ Proper risk management (1-2% per trade)
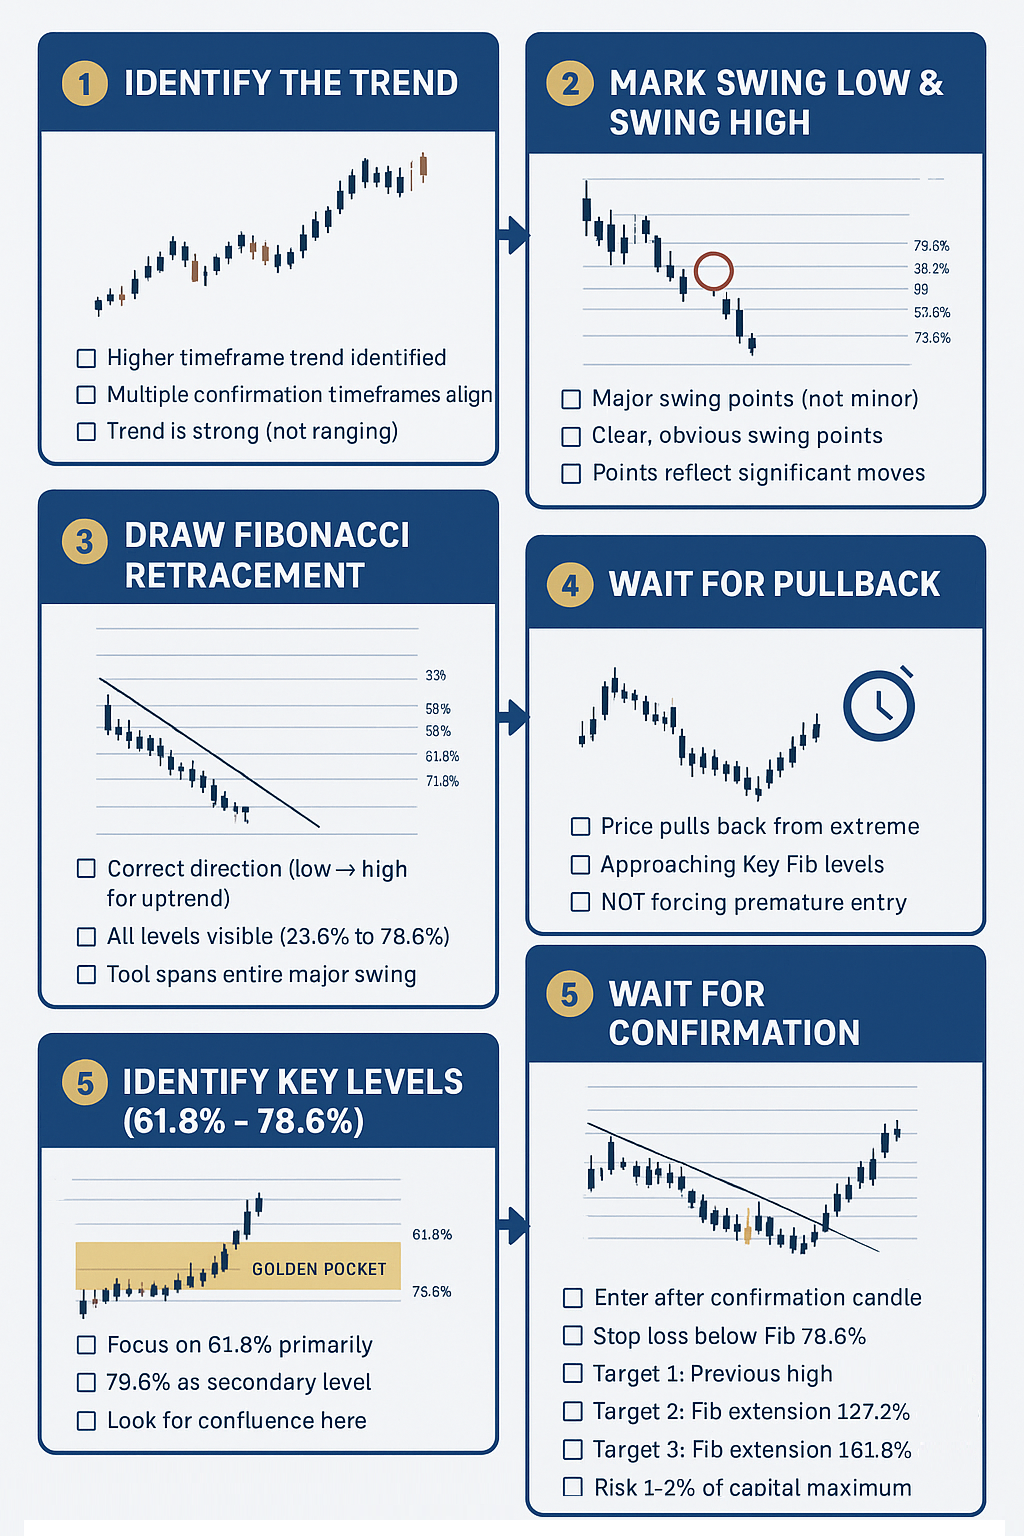
Complete Fibonacci Trading Strategy
The 8-Step Professional System:
- Identify trend on higher timeframes (Daily/Weekly)
- Mark major swing low and swing high (50+ candles)
- Draw Fibonacci: Uptrend (Low→High), Downtrend (High→Low)
- Check for confluence (S/R, MAs, trendlines)
- Wait for price to reach Golden Pocket (61.8-78.6%)
- Wait for confirmation pattern (pin bar, engulfing, order block)
- Enter with stop loss below 78.6%, risk 1-2%
- Scale out at extensions: 127.2%, 161.8%, 200%
Mastering Fibonacci Trading
Fibonacci trading is not magic—it works because millions of traders worldwide watch the same levels, creating self-fulfilling prophecies. The 61.8% golden ratio consistently shows 65-75% accuracy across all markets.
Key Takeaways:
- Focus on the Golden Pocket (61.8-78.6%) for highest probability entries
- Always wait for confirmation patterns—never enter blindly at Fibonacci levels
- Combine Fibonacci with 3+ confluence factors for 70-80% win rates
- Use extensions (127.2%, 161.8%) to set scientific profit targets
- Multi-timeframe analysis dramatically improves accuracy
- Practice patience—quality setups over quantity
Start by paper trading the strategy for 50-100 trades. Track your results, refine your execution, and gradually build confidence. Remember: Fibonacci is a tool, not a crystal ball. Use it as part of a complete trading system with proper risk management.
🎯 Your Next Steps
- 1. Practice Drawing Fibonacci: Go back through historical charts and identify major swings. Practice drawing Fibonacci retracements correctly.
- 2. Study Confluence: Start marking support/resistance, moving averages, and trend lines alongside your Fibonacci levels.
- 3. Paper Trade: Use a demo account to practice the complete 8-step strategy for at least 50 trades.
- 4. Track Your Stats: Record win rate, average R:R, and which confluence factors work best for you.
- 5. Combine with ICT/SMC: Study how Fibonacci integrates with other advanced strategies on our platform.