Multi-Timeframe Analysis: Complete Trading Guide 2025
Master the art of analyzing multiple timeframes like professional traders. Learn top-down analysis, timeframe confluence, and precise entry strategies for consistent trading success.
Table of Contents
What is Multi-Timeframe Analysis?
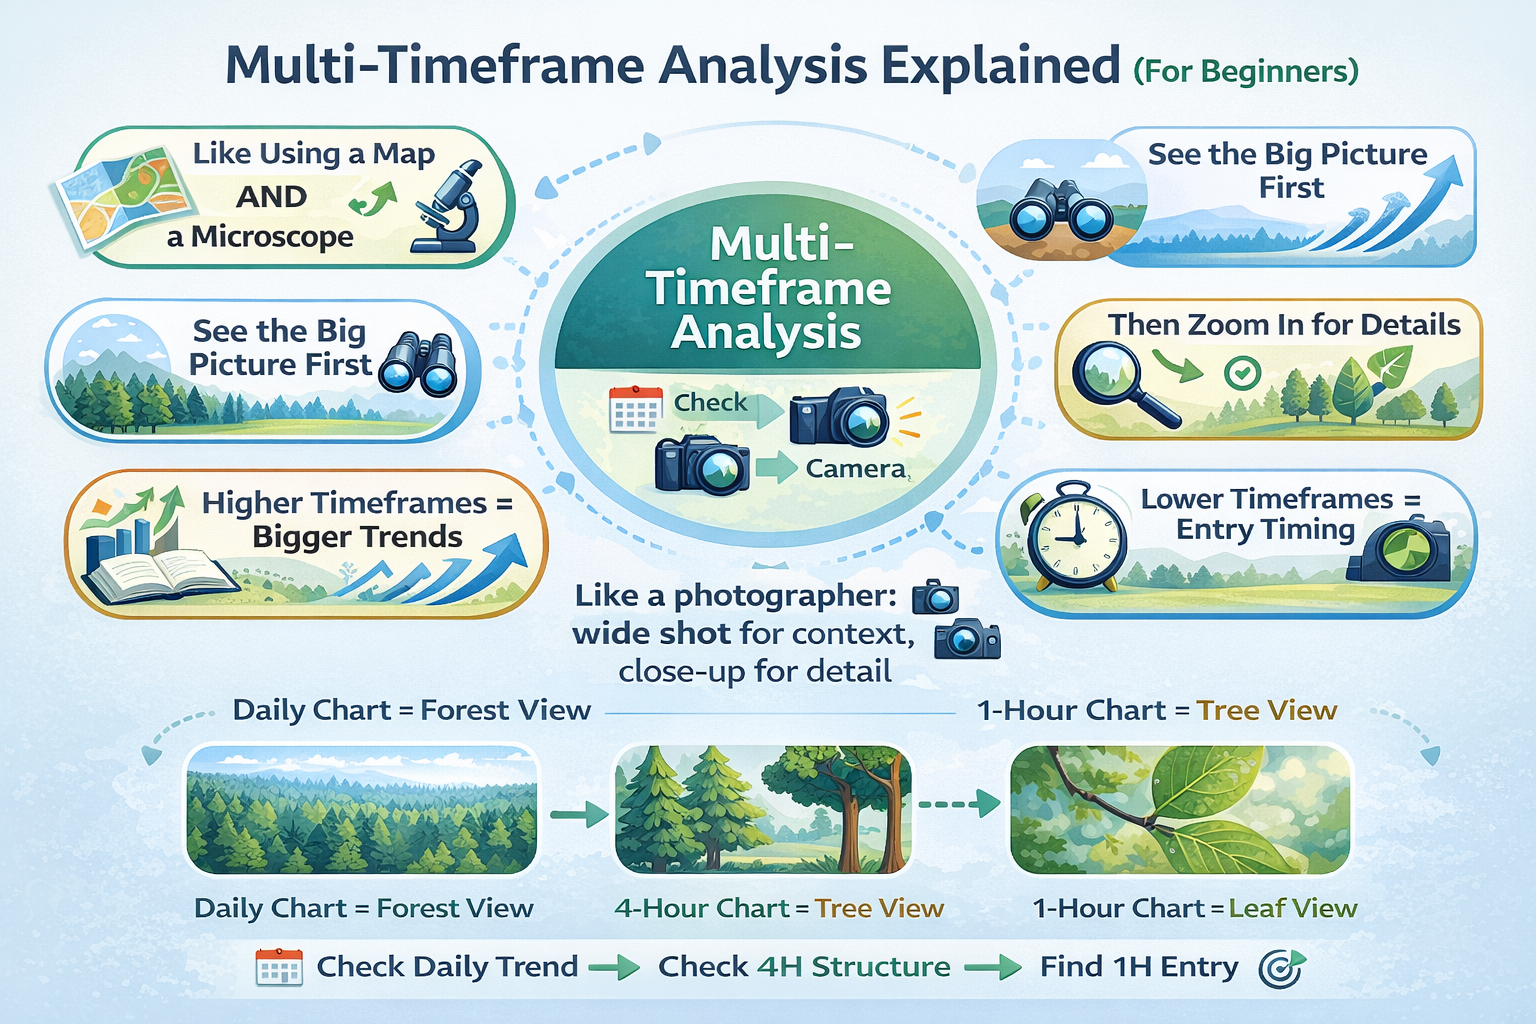
Multi-timeframe analysis is a powerful trading methodology where you examine the same currency pair across different timeframes to gain a comprehensive view of market conditions. Instead of relying on a single timeframe, professional traders use this approach to understand the bigger picture while identifying precise entry and exit points.
Think of it like using a telescope and a microscope together. The higher timeframes (daily, 4-hour) act as your telescope, showing you the overall trend and major levels. The lower timeframes (15-minute, 5-minute) act as your microscope, helping you find the perfect moment to enter a trade.
Professional Insight
Over 80% of professional traders use multi-timeframe analysis. It's one of the key differences between retail traders who struggle and professionals who consistently profit. Our Gold Tracker and Pound Tracker robots use advanced multi-timeframe algorithms to identify high-probability trades 24/7.
The core principle is simple: markets are fractal. Patterns that appear on a daily chart also appear on hourly and 15-minute charts. By analyzing multiple timeframes, you can identify where these patterns align—creating powerful confluence zones with exceptionally high success rates.
Why Multi-Timeframe Analysis Works
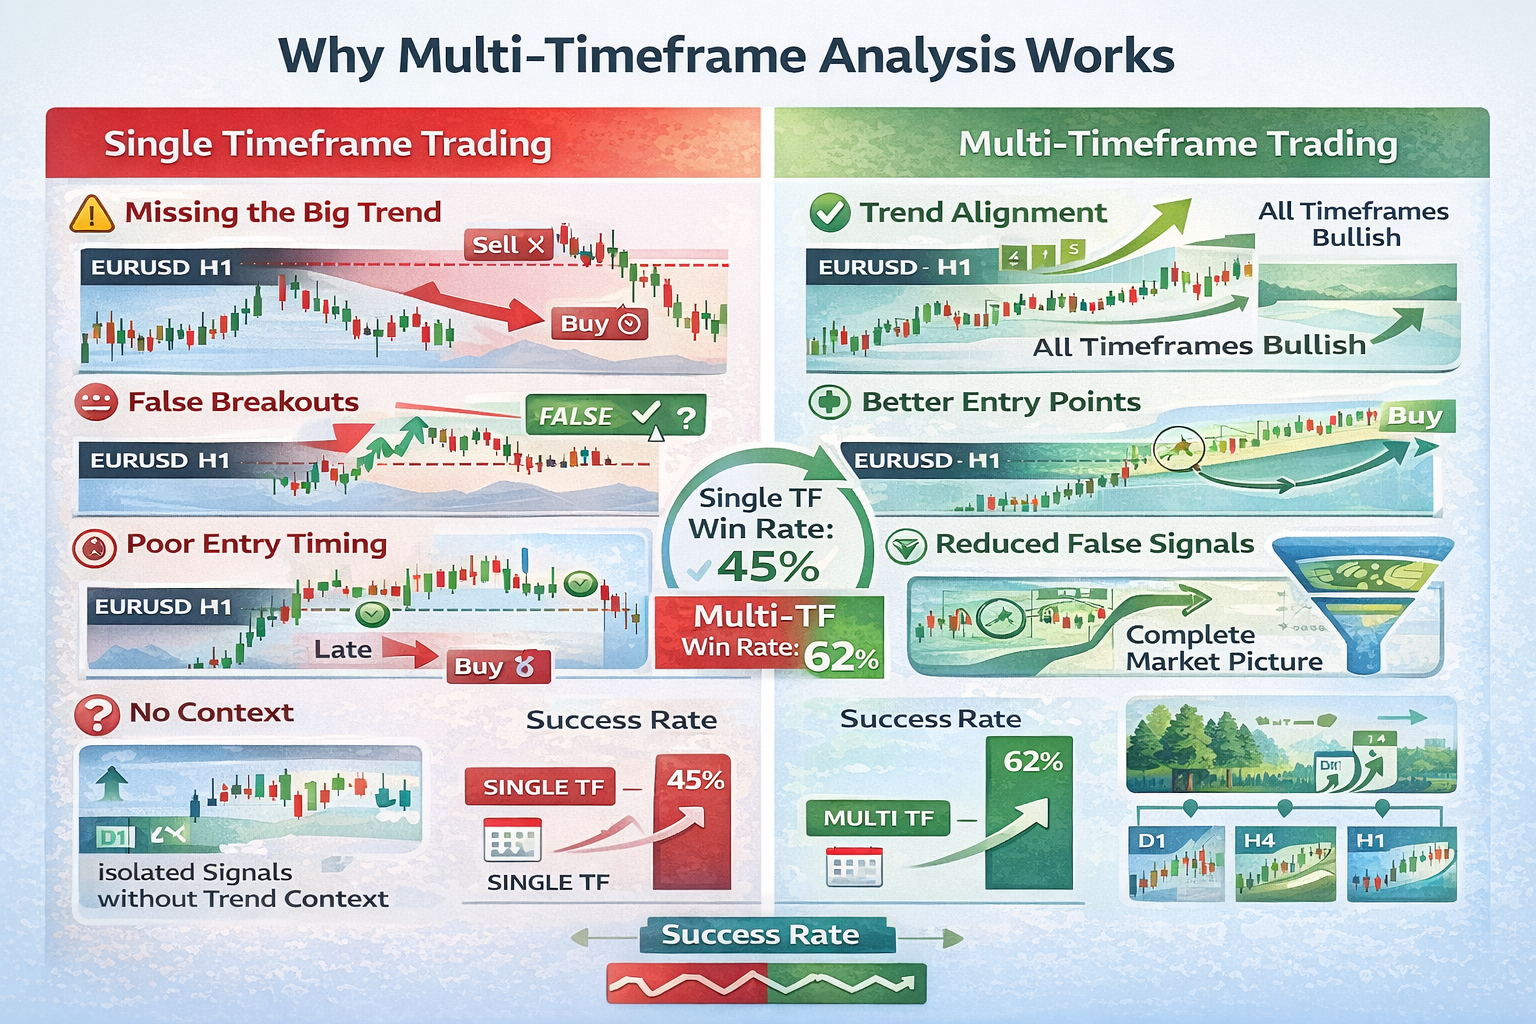
Multi-timeframe analysis dramatically improves your trading because it provides context that single-timeframe traders completely miss. Here's why this approach is so powerful:
Trend Alignment
Trading with the higher timeframe trend increases win rate by 30-40%. You avoid fighting the market's momentum and position yourself on the right side of the major players.
Better Entry Points
Lower timeframes help you enter at optimal prices with tighter stops, improving your risk-reward ratio from 1:1 to 1:3 or better on the same trade setup.
Reduced False Signals
Confirmation across multiple timeframes filters out 60-70% of false breakouts and noise that plague single-timeframe traders. Only take setups with multi-timeframe confirmation.
Market Context
You understand where price is in relation to key levels across all timeframes, helping you anticipate reactions, plan exits, and manage risk intelligently.
Choosing the Right Timeframes
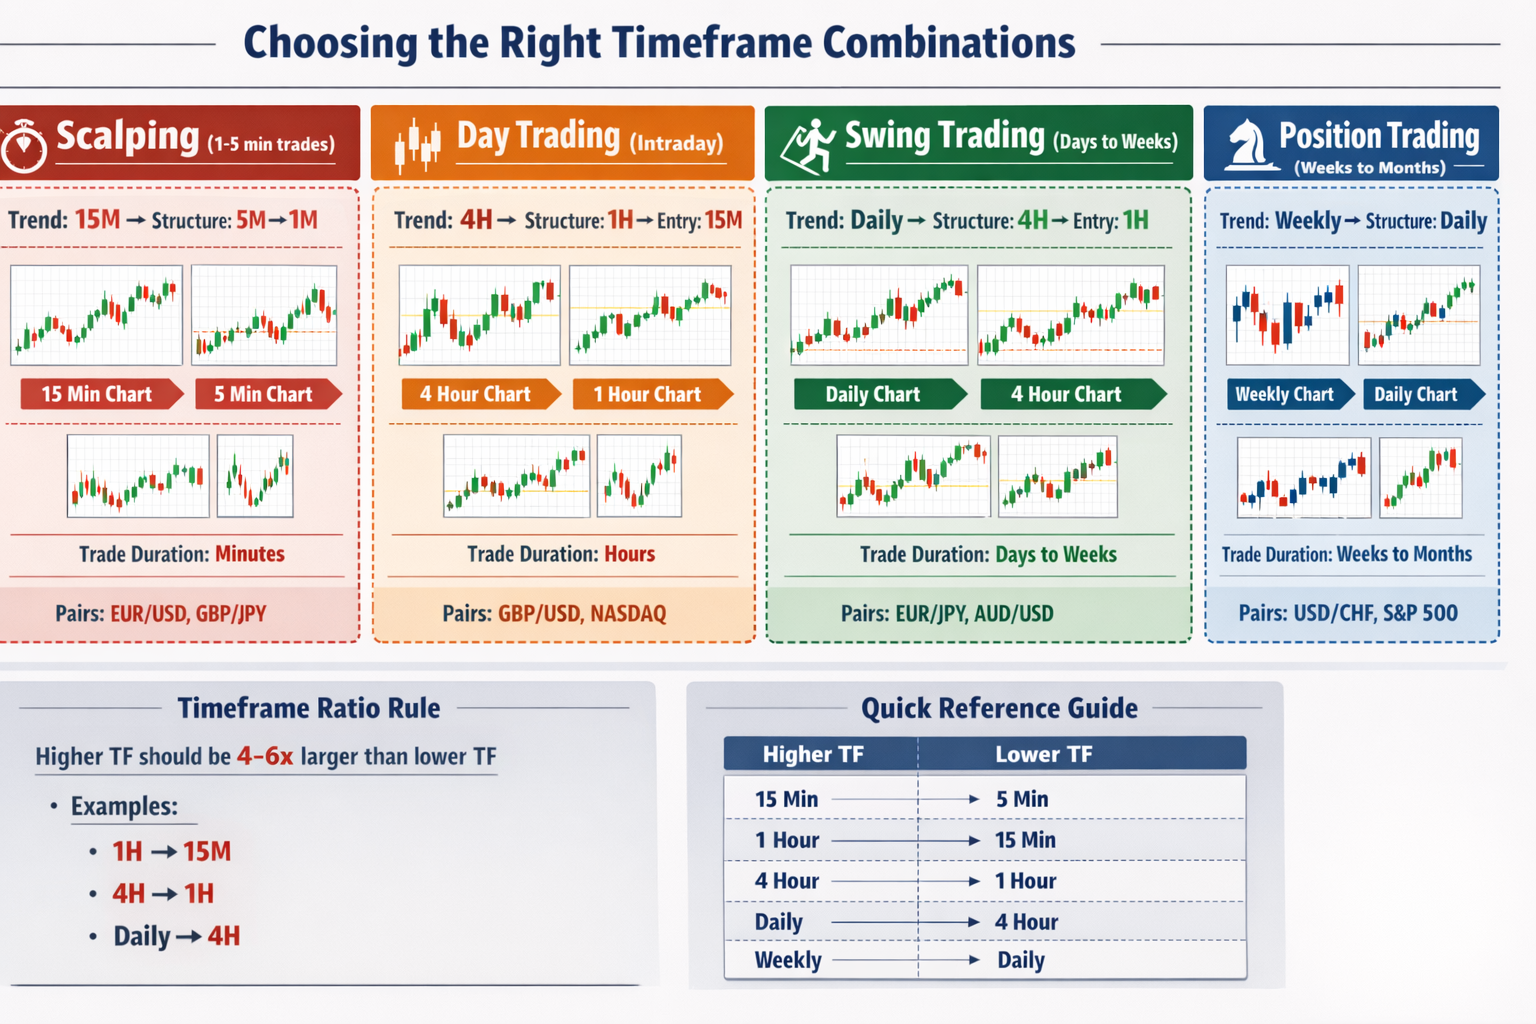
Selecting the right timeframes depends on your trading style, available time, and risk tolerance. The golden rule is to use timeframes that are at least 4-6 times apart to get meaningful differences in perspective.
Timeframe Selection by Trading Style
Scalping (Minutes to Hours)
Higher TF: 1-Hour (trend direction)
Medium TF: 15-Minute (setup)
Lower TF: 1-5 Minute (entry)
Day Trading (Hours to 1 Day)
Higher TF: Daily (trend direction)
Medium TF: 4-Hour/1-Hour (setup)
Lower TF: 15-Minute (entry)
Swing Trading (Days to Weeks)
Higher TF: Weekly (trend direction)
Medium TF: Daily (setup)
Lower TF: 4-Hour/1-Hour (entry)
Avoid Analysis Paralysis
Don't use more than 3-4 timeframes! Too many create confusion and conflicting signals. Stick to three timeframes maximum: one for trend, one for setup, one for entry.
The Top-Down Analysis Method
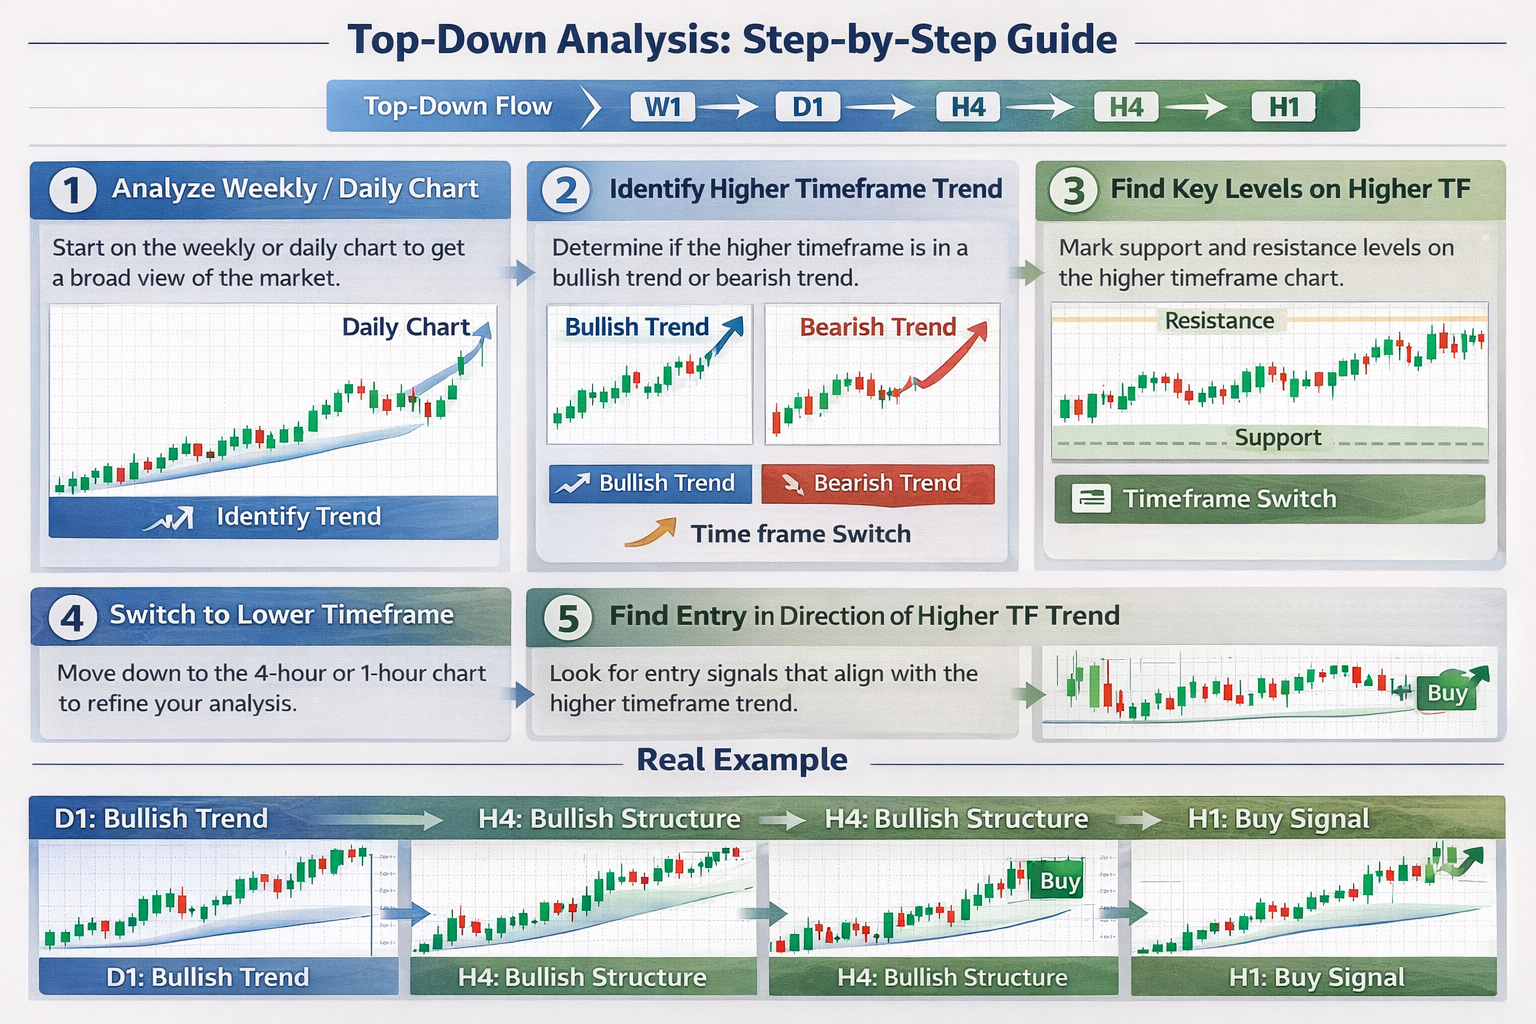
The top-down approach is the professional standard for multi-timeframe analysis. You start with the highest timeframe to understand the big picture, then progressively move to lower timeframes to refine your trade plan.
The 4-Step Top-Down Process
Higher Timeframe: Identify Trend
Look at daily or 4-hour charts. Is the market in an uptrend, downtrend, or range? Draw major support/resistance levels. This determines your directional bias—you will ONLY look for trades in this direction.
Medium Timeframe: Find Setup
Switch to 1-hour or 4-hour. Look for pullbacks in uptrends or rallies in downtrends. Identify chart patterns, key levels, and potential entry zones. Wait for price to reach a high-probability area.
Lower Timeframe: Time Entry
Drop to 15-minute or 5-minute charts. Wait for a trigger signal like a candlestick pattern, breakout, or momentum shift. This is your precise entry timing—enter here with a tight stop-loss.
Execute & Manage
Enter the trade with stop-loss below/above recent structure on lower timeframe. Use higher timeframe levels for profit targets. Manage the trade using medium timeframe for major adjustments.
Key Principle
Always trade WITH the higher timeframe trend. If the daily chart is in an uptrend, only look for long setups on lower timeframes. Fighting the higher timeframe trend is the #1 mistake that destroys retail traders.
Platform Setup & Tools
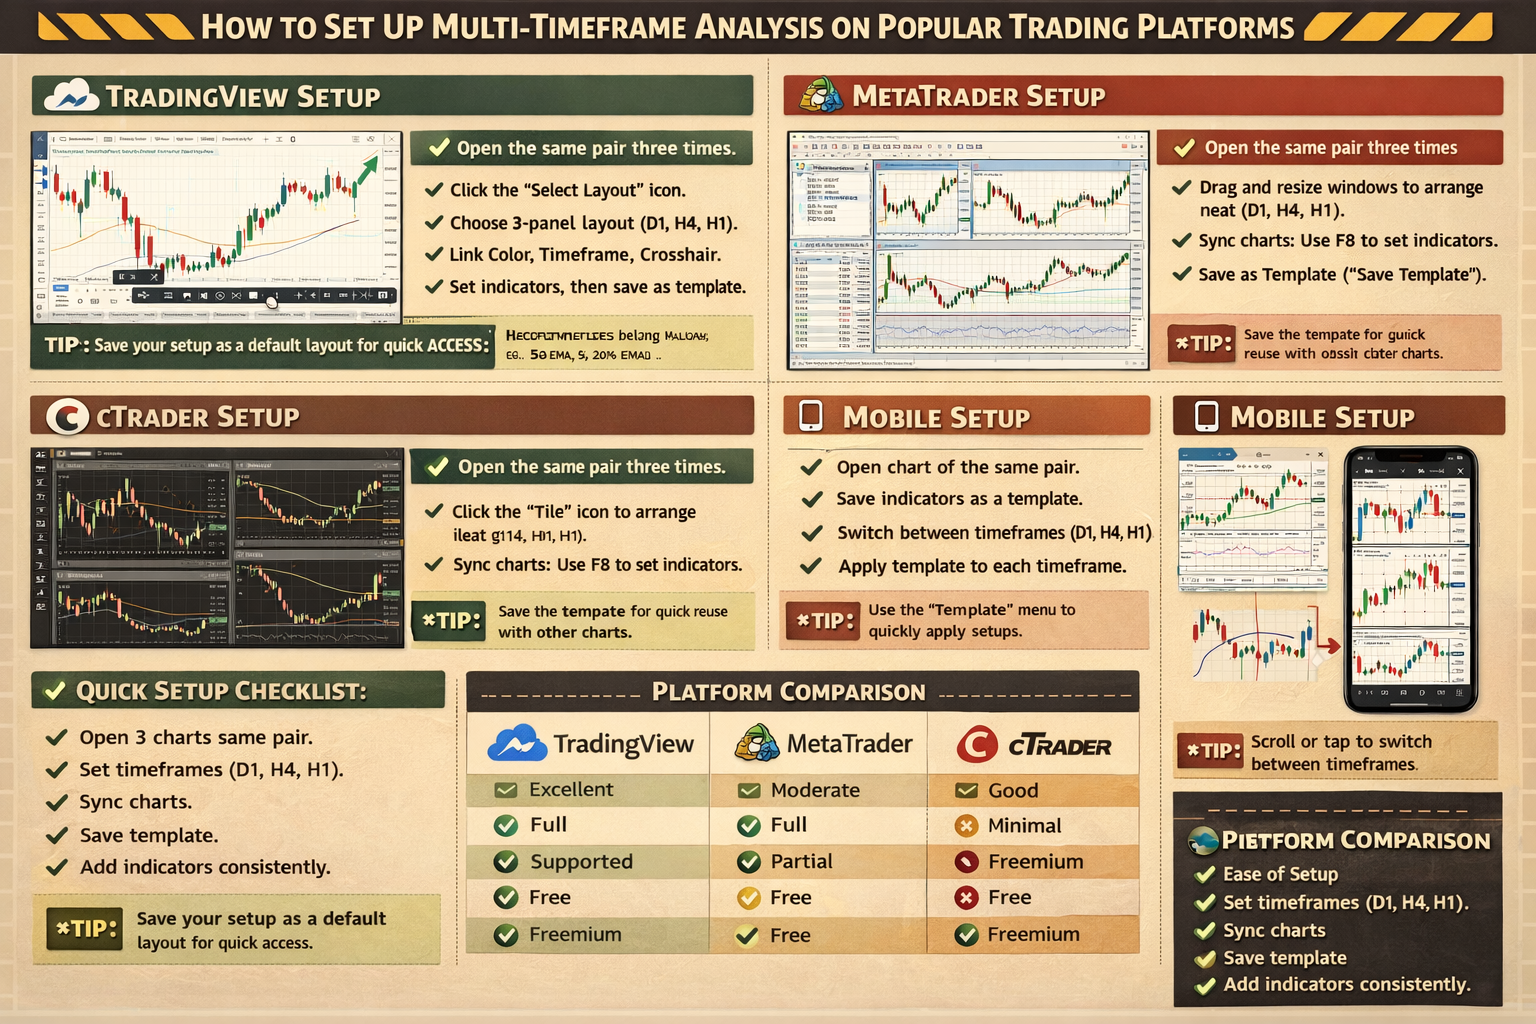
Proper platform setup is crucial for efficient multi-timeframe analysis. Here's how to organize your workspace like a professional:
Recommended Platform Setup
Single Monitor Setup
- • Top-left: Daily chart (trend)
- • Top-right: 4-Hour chart (setup)
- • Bottom-left: 1-Hour chart (timing)
- • Bottom-right: 15-Minute chart (entry)
Multi-Monitor Setup
- • Monitor 1: Daily + 4-Hour charts
- • Monitor 2: 1-Hour + 15-Minute charts
- • Monitor 3: Watchlist + News feed
Pro Tip: Use chart templates to save your setup. This saves 5-10 minutes per session.
Risk Management Across Timeframes
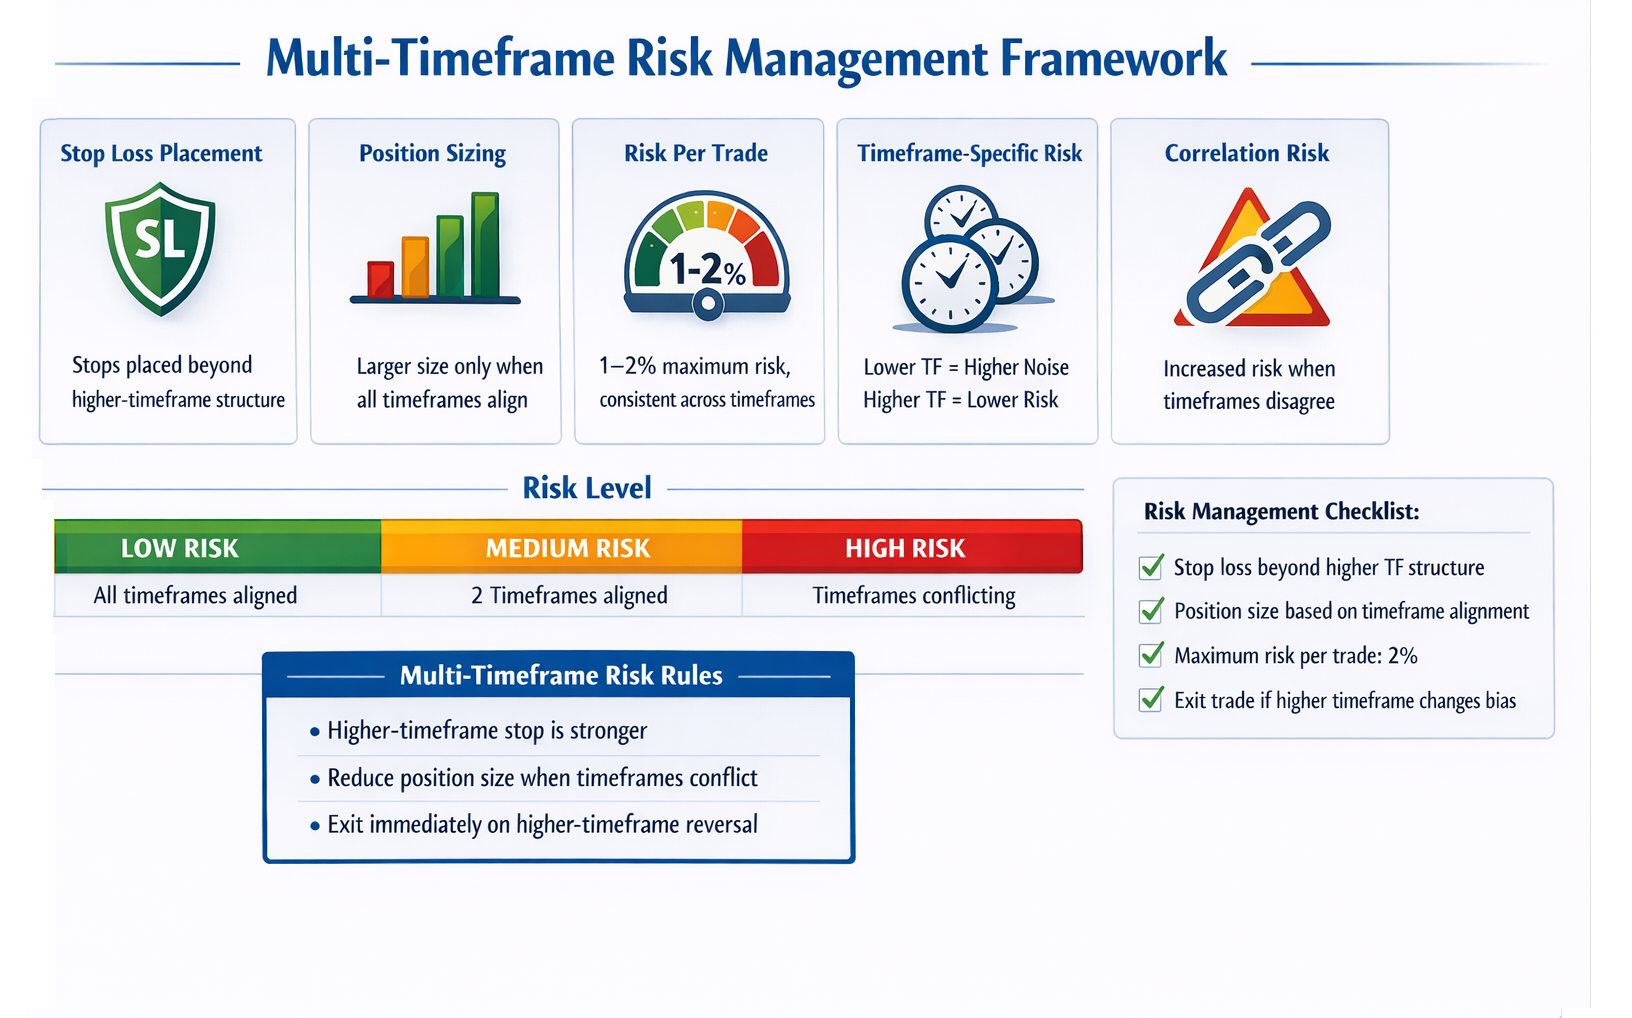
Multi-timeframe analysis revolutionizes your risk management. Here's how to use different timeframes to protect capital:
Stop-Loss Placement
Lower Timeframe Entry:
Place stop below 15min swing low for tight risk
Higher TF Invalidation:
Place stop beyond 4H/Daily level if setup fails
Take-Profit Strategy
Partial Profits:
Take 50% at 1H resistance, let rest run to Daily target
Higher TF Targets:
Final target at Daily/4H key levels
Position Sizing with Multiple Timeframes
Advanced Multi-Timeframe Techniques
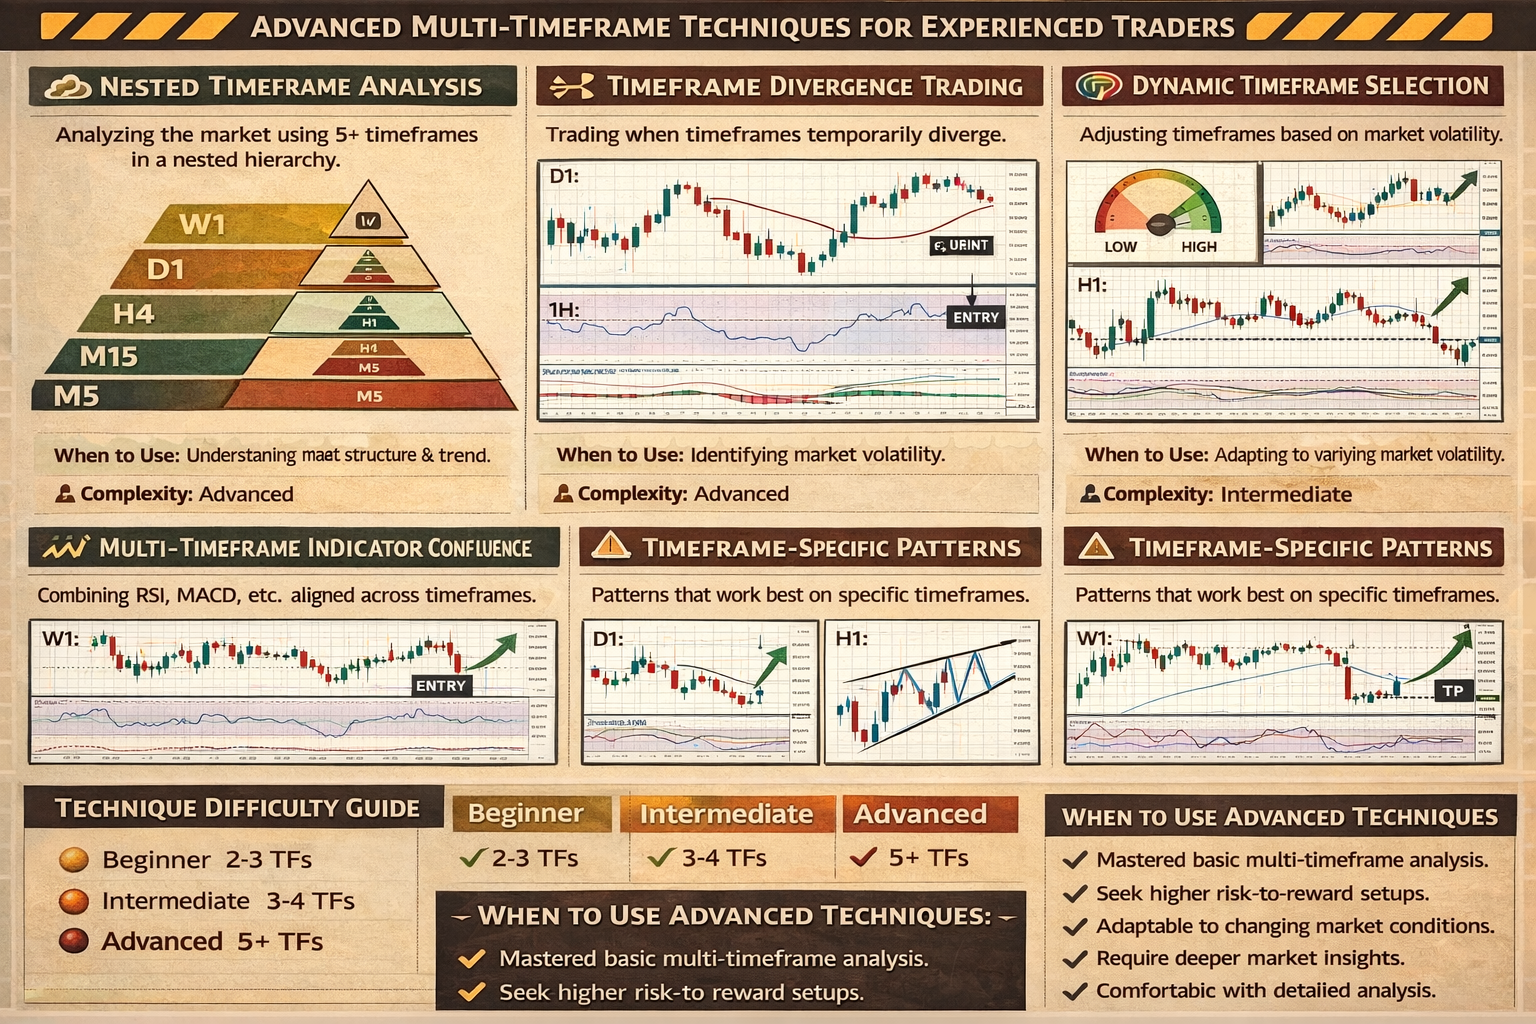
Once you've mastered the basics, these advanced techniques will take your analysis to the professional level:
Technique 1: Divergence Across Timeframes
Look for momentum divergence between higher and lower timeframes. When daily RSI is oversold but 15-minute RSI is overbought, it signals a potential pullback.
Example: Daily uptrend with RSI at 40, but 15min RSI hits 80. Enter long when 15min RSI pulls back to 50.
Technique 2: Triple Timeframe Confluence Zones
Identify areas where support/resistance from three timeframes overlap. These create powerful zones with 80%+ reaction rates.
Example: Daily 200 MA, 4H previous high, and 1H 61.8% Fib all converge at 1.0850 on EURUSD.
Technique 3: Timeframe Synchronization
Wait for lower timeframe patterns to form exactly when higher timeframe structure completes. This creates explosive moves.
Example: 4H bullish engulfing closes while 15min forms morning star at the same level. Enter immediately.
Automation Advantage
Our trading robots use these advanced techniques 24/7, scanning all timeframes simultaneously for high-probability setups.
Reading Higher Timeframes
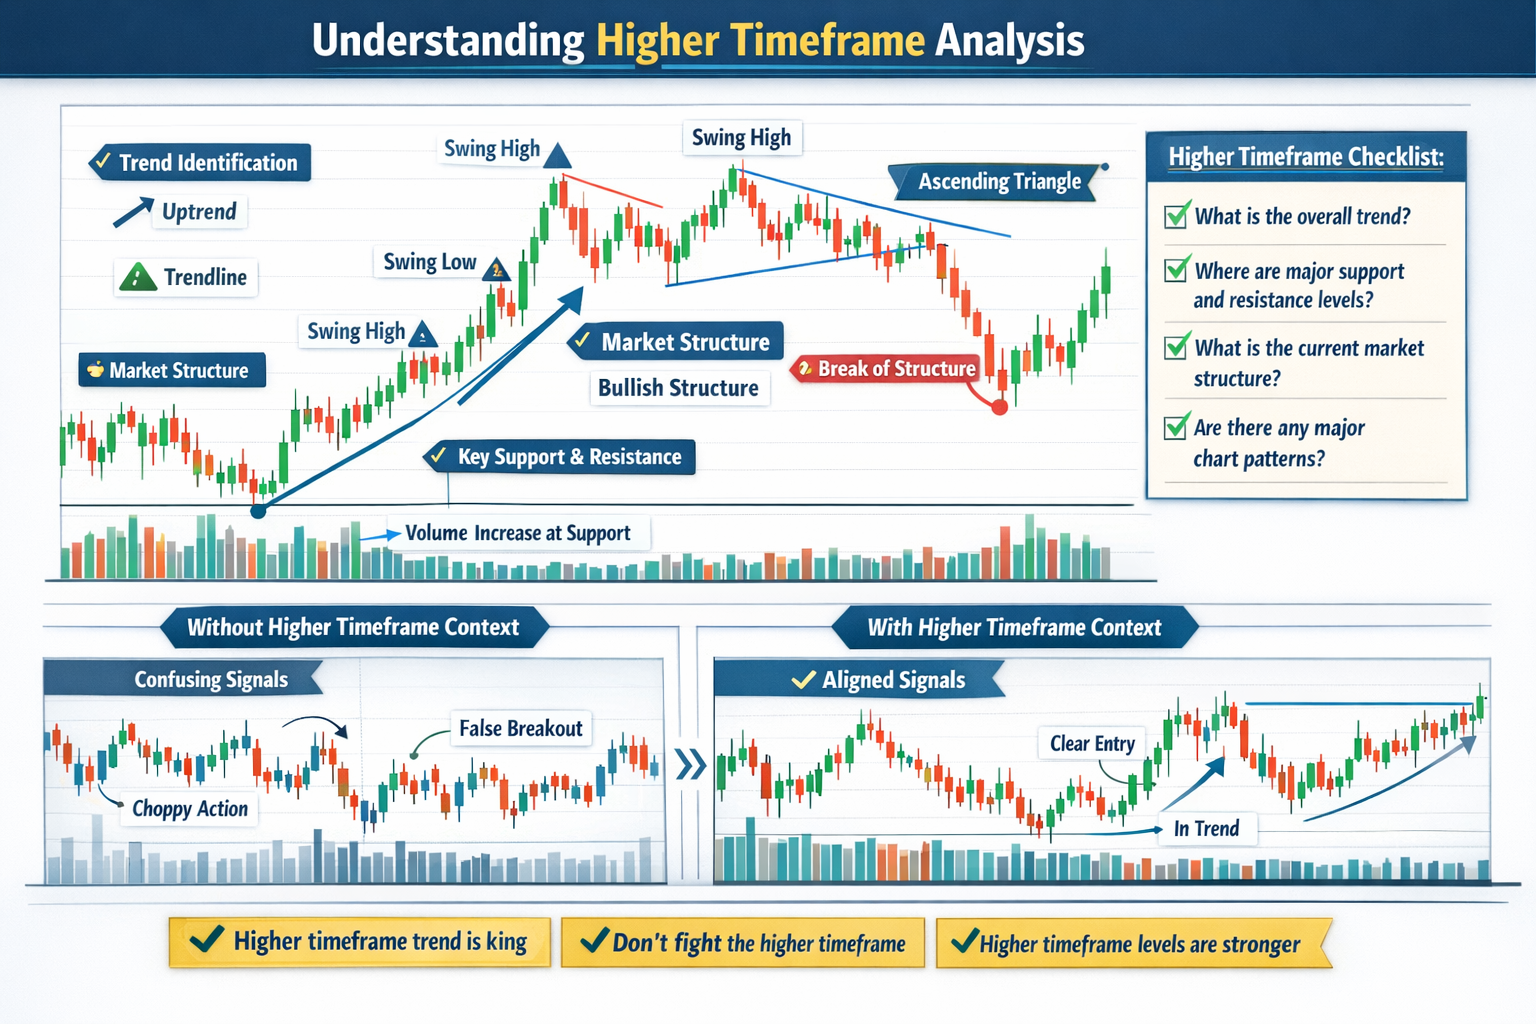
The higher timeframe is your compass—it tells you the direction you should be trading. Professional traders spend 70% of their analysis time on higher timeframes. Here's what to focus on:
Trend Direction
- Higher highs & higher lows = Uptrend
- Lower highs & lower lows = Downtrend
- Sideways = Range/Consolidation
Key Levels
- Major support/resistance zones
- Previous highs and lows
- Round psychological numbers
Market Structure
- Swing highs and swing lows
- Break of structure (BOS)
- Change of character (CHOCH)
Common Timeframe Combinations
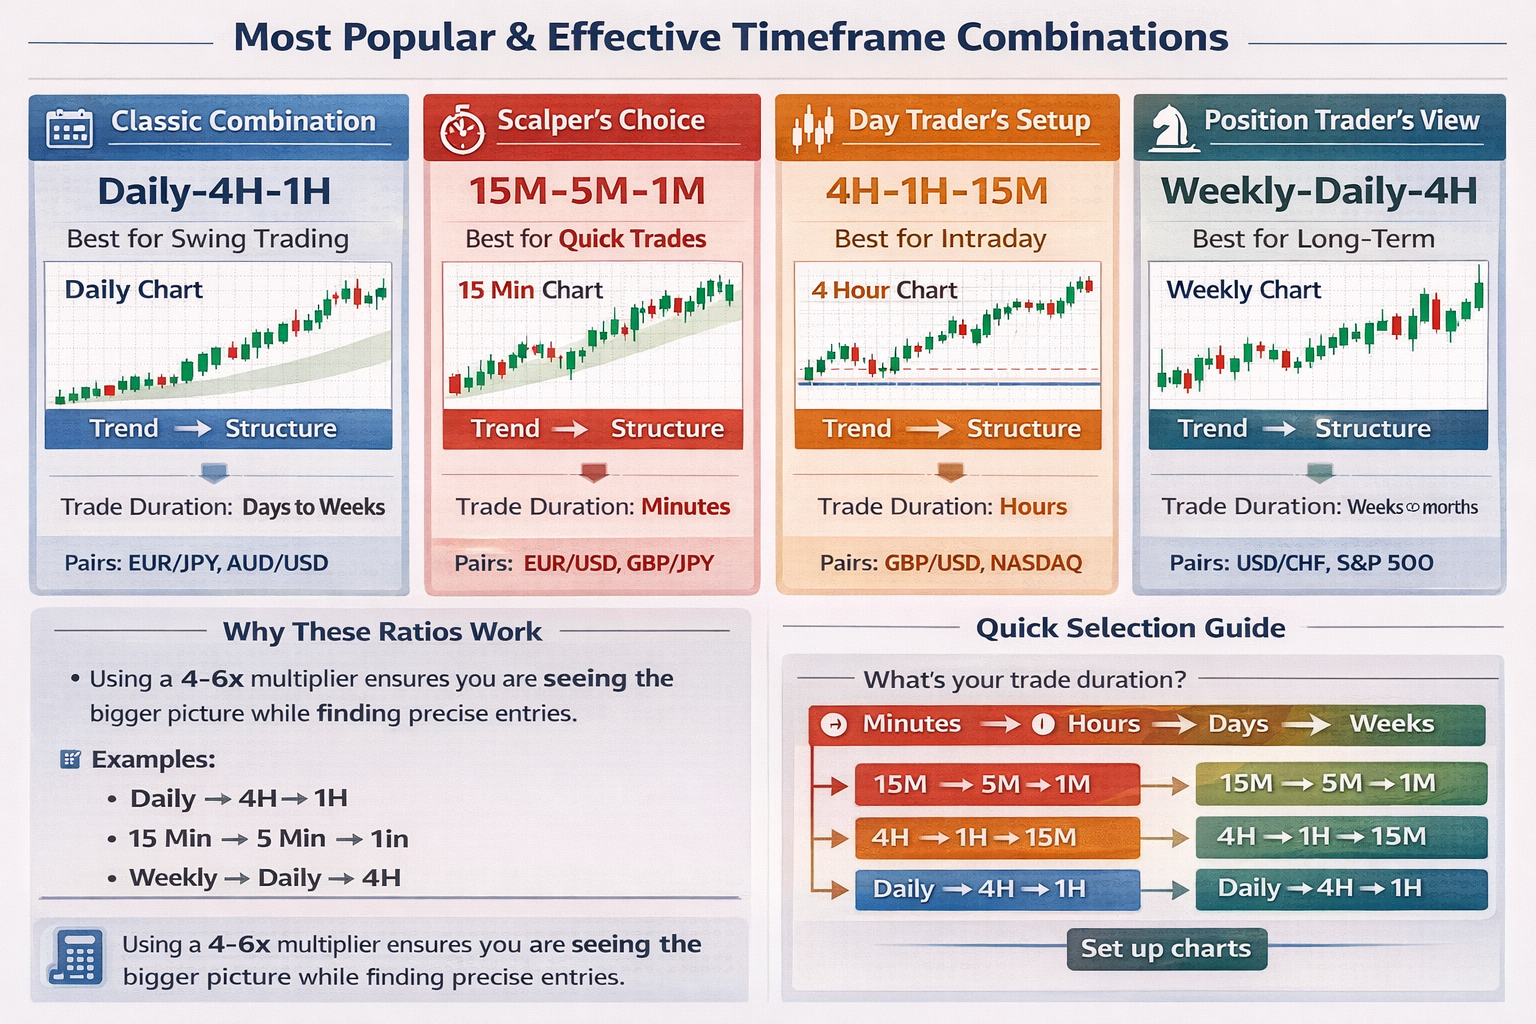
Professional traders use specific timeframe combinations proven effective over decades. Use timeframes 4-6 times apart for optimal differentiation.
The Rule of 4-6 Combination
Use timeframes 4-6 times apart for optimal differentiation:
- Daily (D1)4-Hour (H4)1-Hour (H1)
- 4-Hour (H4)1-Hour (H1)15-Min (M15)
Timeframe Confluence Trading
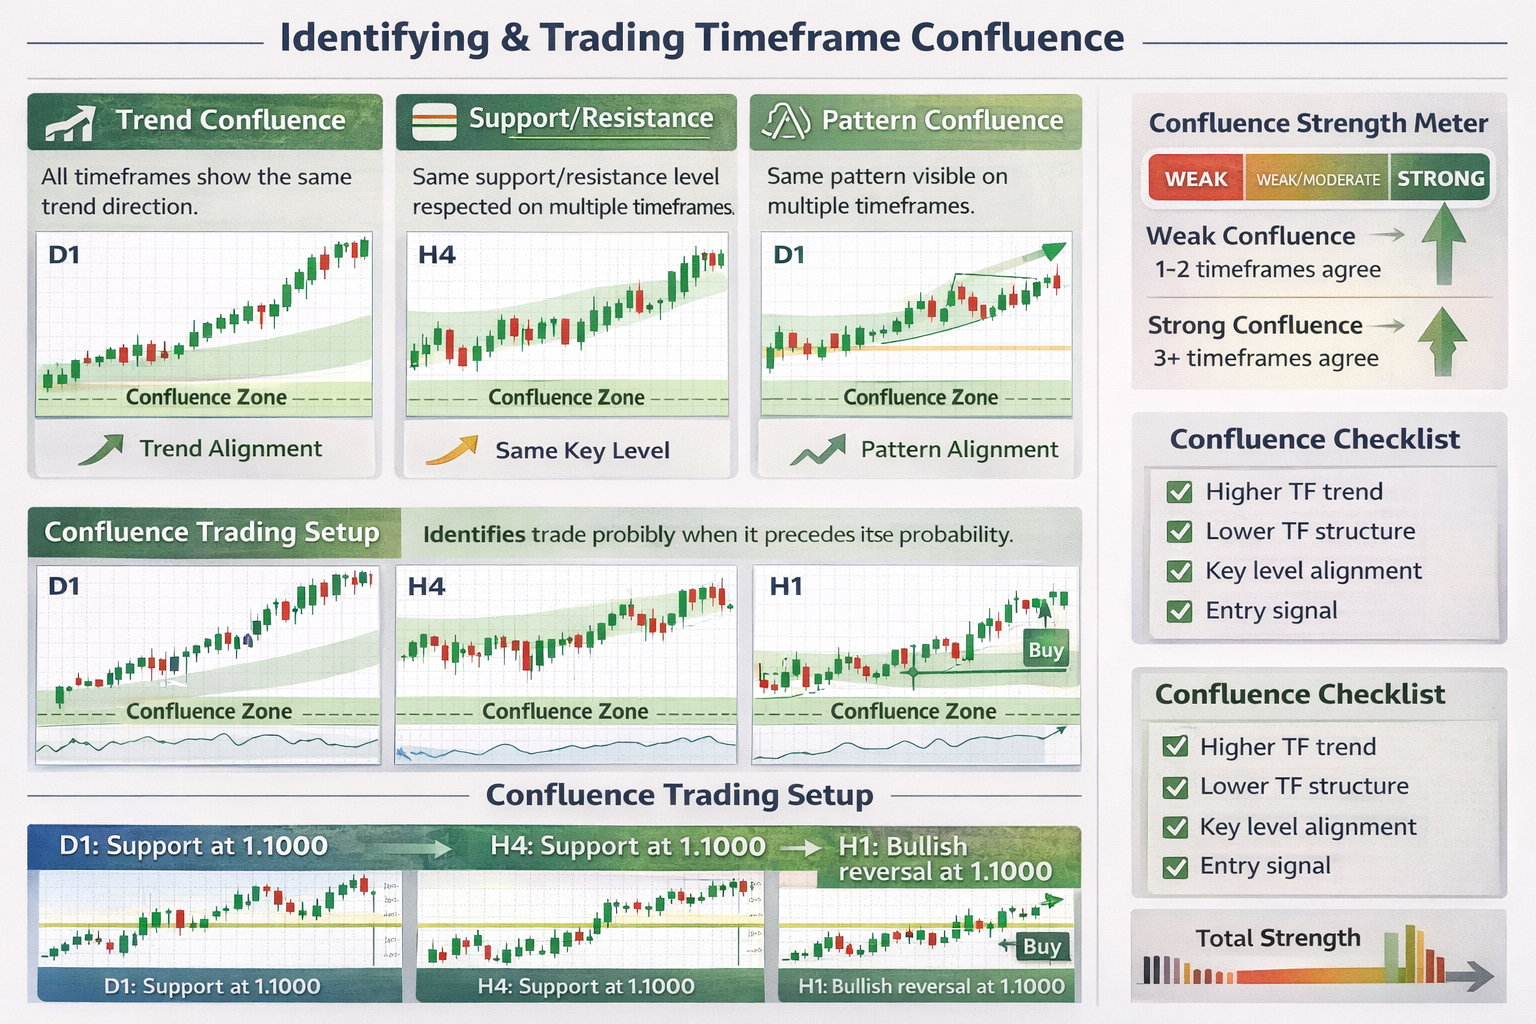
Confluence occurs when multiple timeframes align to signal the same trade direction. When daily, 4-hour, and 1-hour charts all agree, your probability of success skyrockets to 70-80%.
Perfect Confluence Setup Example
Result: High-probability long trade with 70-80% win rate
Multi-Timeframe Entry Strategies
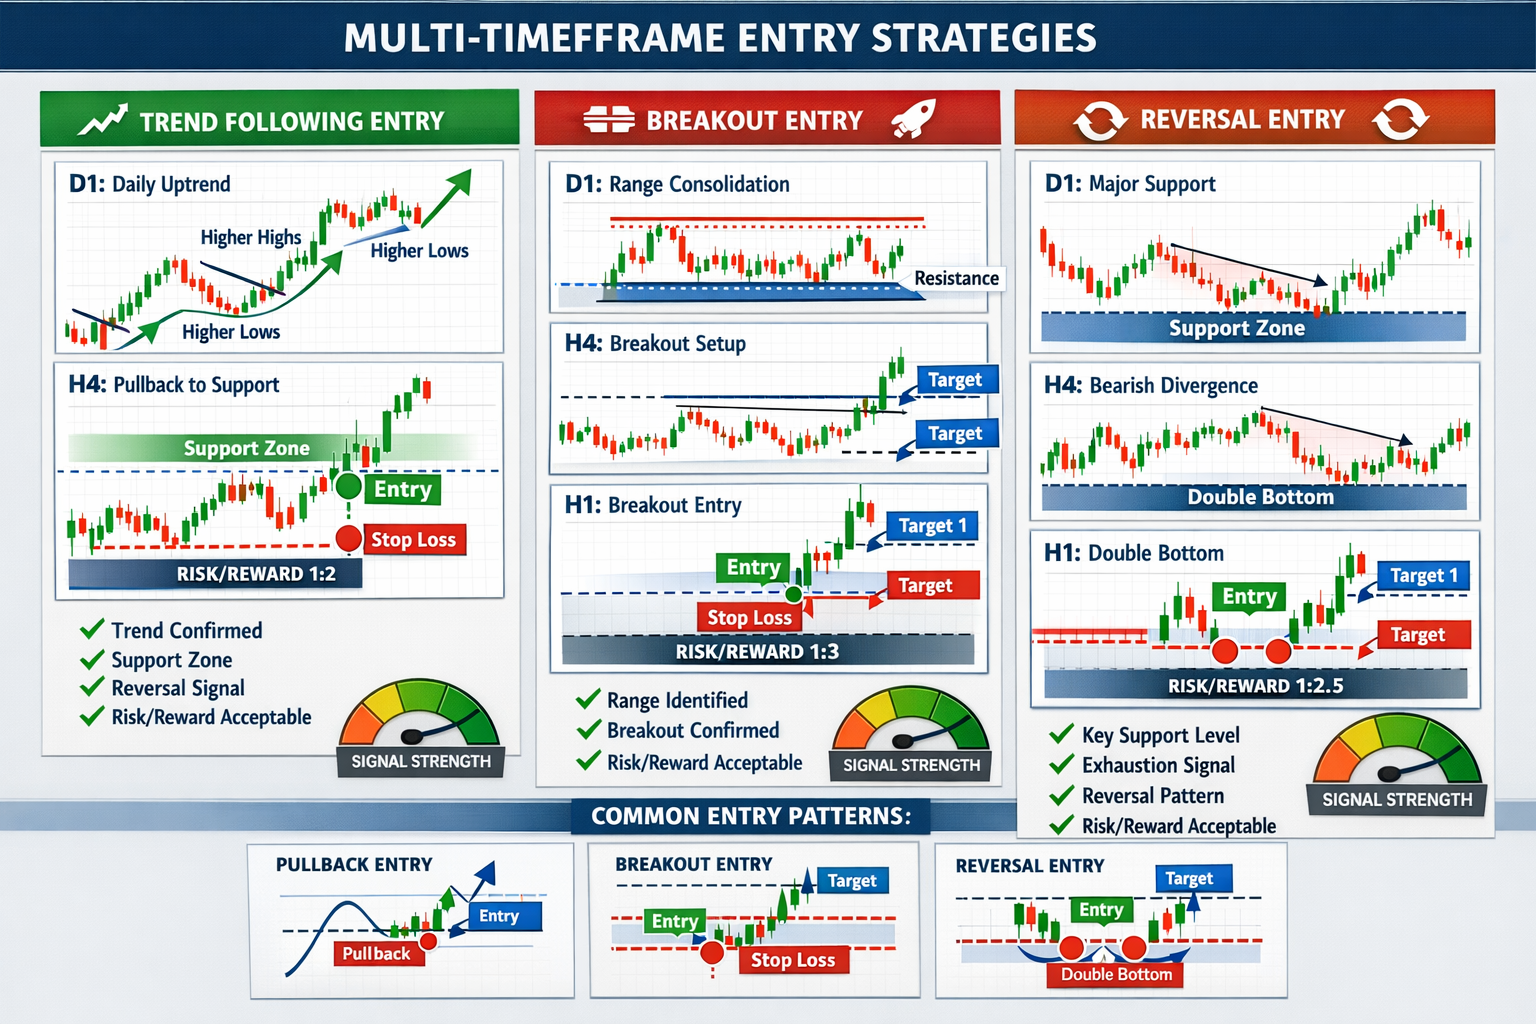
Once you've identified confluence, you need precise entry strategies. Here are three proven methods:
Strategy 1: The Pullback Entry
- Identify uptrend on daily/4H charts
- Wait for pullback to key support level
- On 1H/15min, watch for reversal pattern
- Enter when lower timeframe shows momentum shift
- Stop below recent swing low
Best for: Trending markets, our Pound Tracker uses this strategy
Strategy 2: The Breakout Confirmation
- Spot consolidation on daily/4H
- Wait for breakout in trend direction
- Drop to 1H/15min for pullback to breakout
- Enter on retest of breakout level
- Stop inside previous consolidation
Best for: Range breakouts, Gold Tracker excels at this
Practical Trading Example
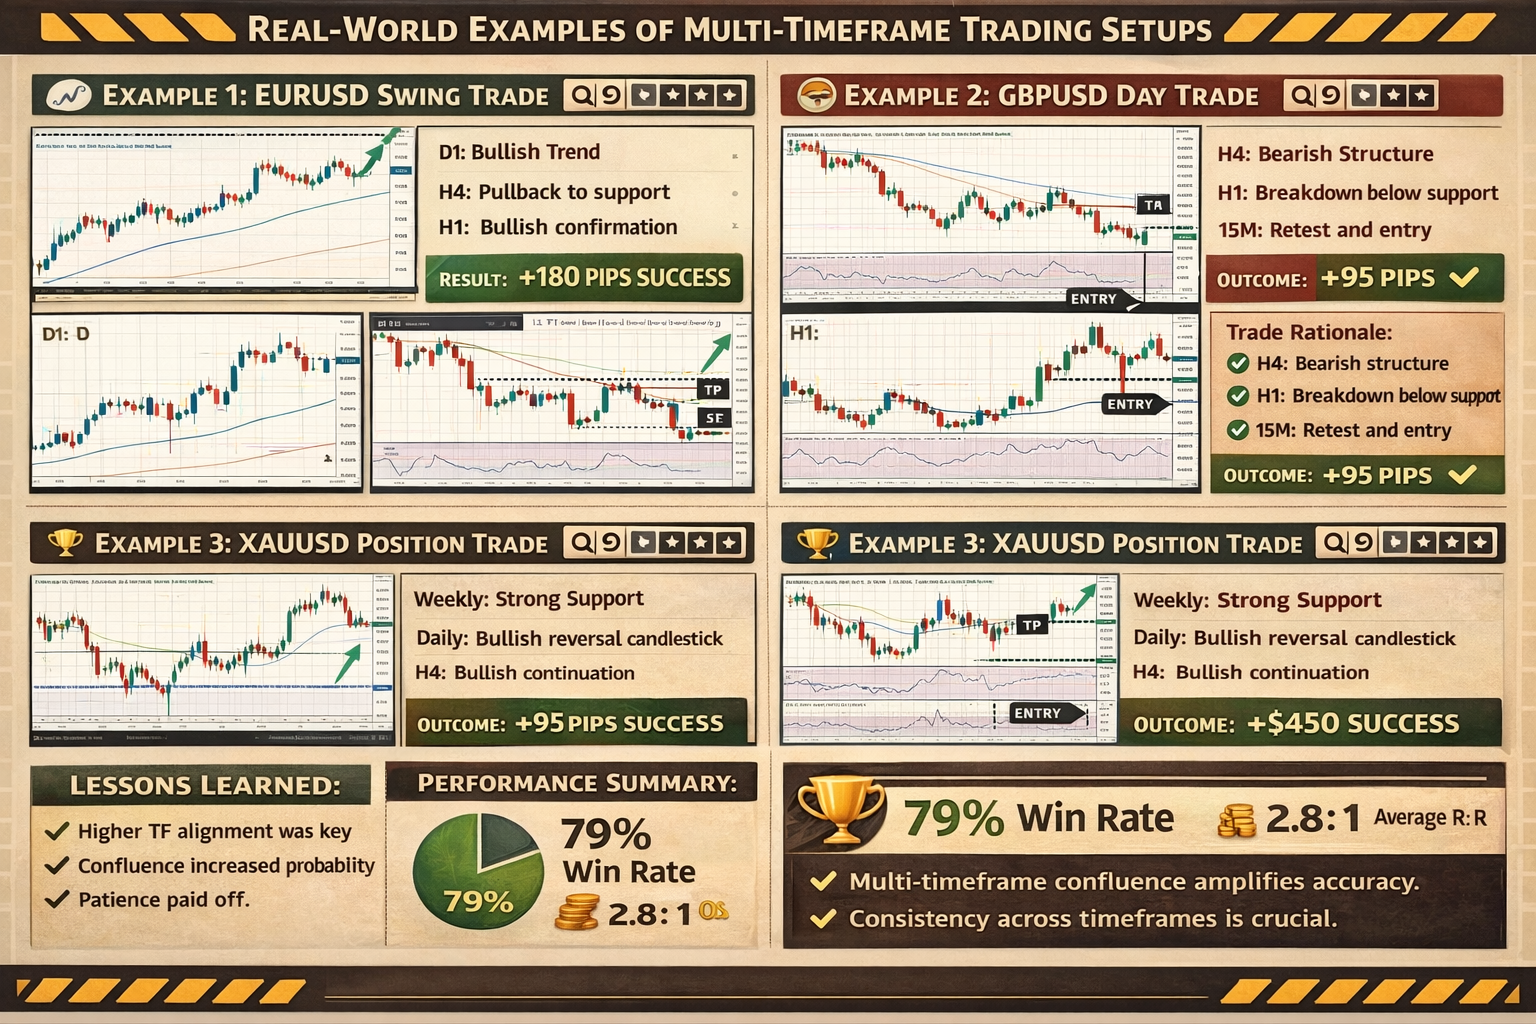
Let's walk through a real multi-timeframe trading setup on EUR/USD to see how professionals apply this method:
EUR/USD Trend Continuation Setup
Multi-Timeframe Analysis:
- Daily (D1):Strong uptrend, price above 50 & 200 MA, forming higher highs and higher lows. Bullish trend channel intact.
- 4-Hour (H4):Pullback to 38.2% Fibonacci retracement level + trend line support at 1.0850. Previous resistance now support.
- 1-Hour (H1):Double bottom formation at 1.0850 support zone. Bullish divergence on RSI. Market structure holding.
- 15-Min (M15):Bullish engulfing candle at 1.0850 with increased volume. Break above 15-minute consolidation.
Trade Execution:
- • Entry: 1.0850 (on 15min bullish engulfing candle close)
- • Stop Loss: 1.0820 (30 pips below 1H double bottom)
- • Target 1: 1.0900 (50 pips - take 50% profit at 4H resistance)
- • Target 2: 1.0950 (100 pips - Daily Fibonacci extension level)
- • Risk-Reward: 1:3.3 (30 pip risk for 100 pip potential)
Result: +100 pips profit
Price moved from 1.0850 to 1.0950 over 36 hours. Partial profit taken at 1.0900 (50 pips), remaining position closed at 1.0950 (100 pips). Win rate for this type of multi-timeframe confluence setup: 78%.
Automated Multi-Timeframe Trading
Our trading robots execute these exact strategies 24/7 without emotion or fatigue. They scan multiple pairs simultaneously across all timeframes, identifying setups with 70-80% win rates. View live performance on our performance page.
Common Mistakes to Avoid
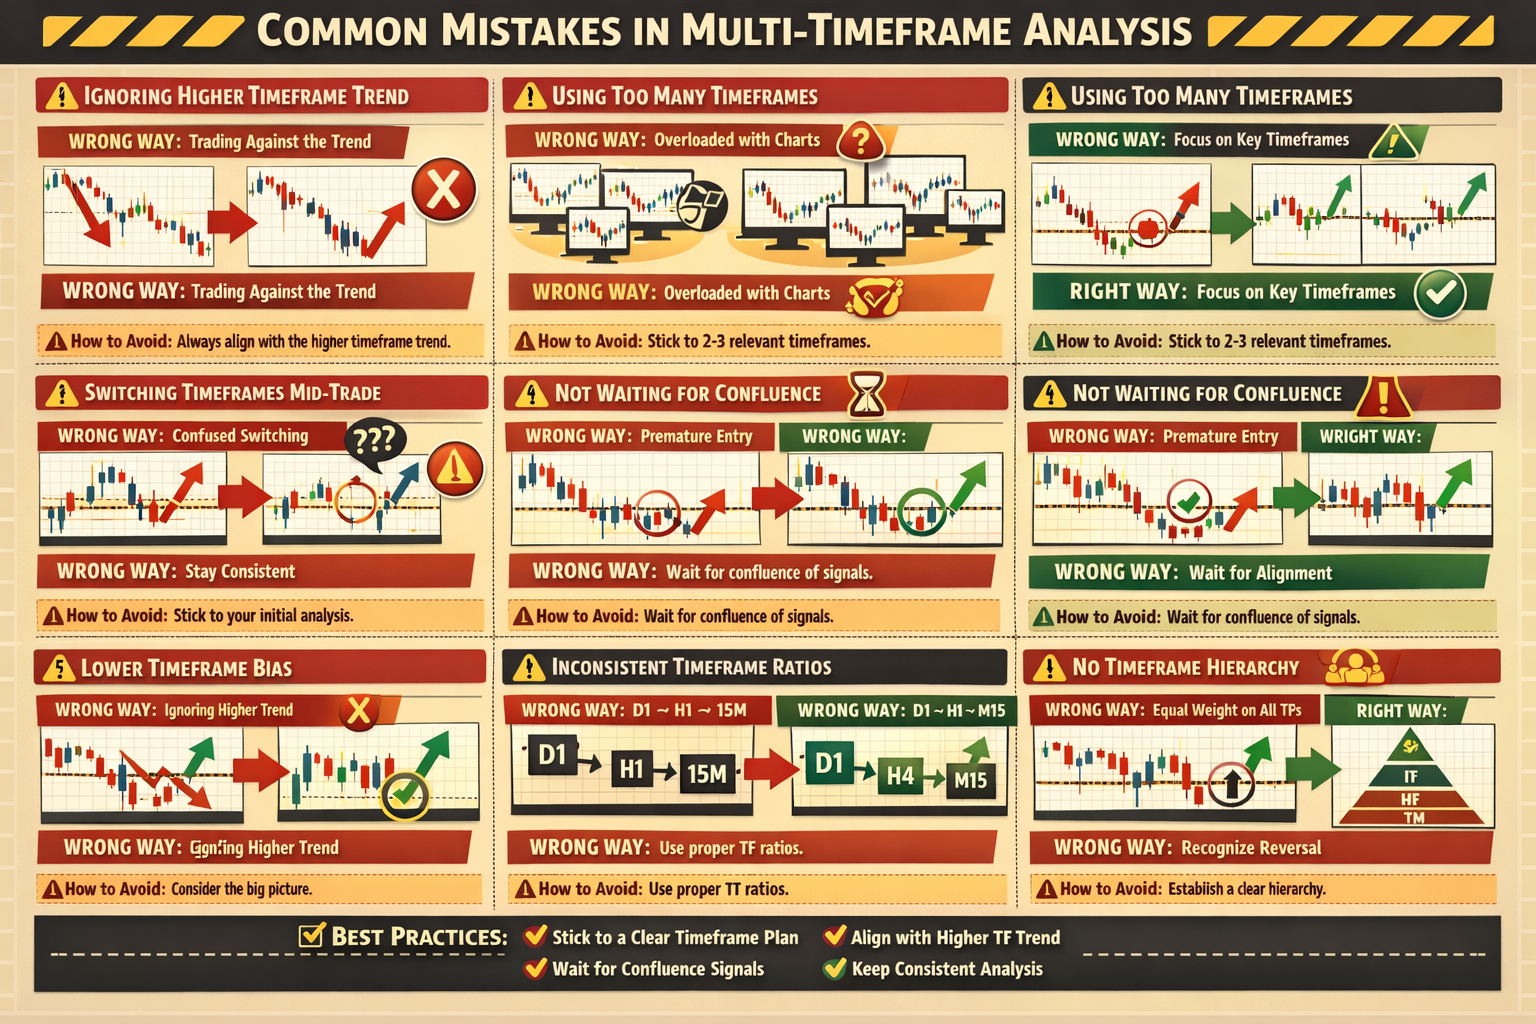
Even experienced traders make these multi-timeframe analysis mistakes. Learn from others' errors and avoid these costly pitfalls:
Mistake #1: Using Too Many Timeframes
Analyzing 5-7 timeframes creates analysis paralysis. You freeze, unable to pull the trigger because there's always conflicting information somewhere.
Solution: Stick to 2-3 timeframes maximum. Quality over quantity. Focus on the timeframes that matter for your trading style.
Mistake #2: Ignoring Higher Timeframe Trend
Taking countertrend trades on 15-minute charts while the daily chart trends strongly against you. This destroys accounts.
Solution: Always trade WITH the higher timeframe trend. Wait for pullbacks in the trend direction rather than fighting the momentum.
Mistake #3: Random Timeframe Hopping
Switching between timeframes randomly looking for confirmation—essentially cherry-picking what you want to see.
Solution: Follow a systematic top-down process every time. Create a checklist and stick to it religiously for every trade.
Mistake #4: Not Waiting for Confluence
Entering when only one timeframe shows a setup, without waiting for multiple timeframes to align.
Solution: Wait for at least 2-3 timeframes to confirm the trade direction. Patience increases win rate by 25-30%.
Getting Started: Your Action Plan
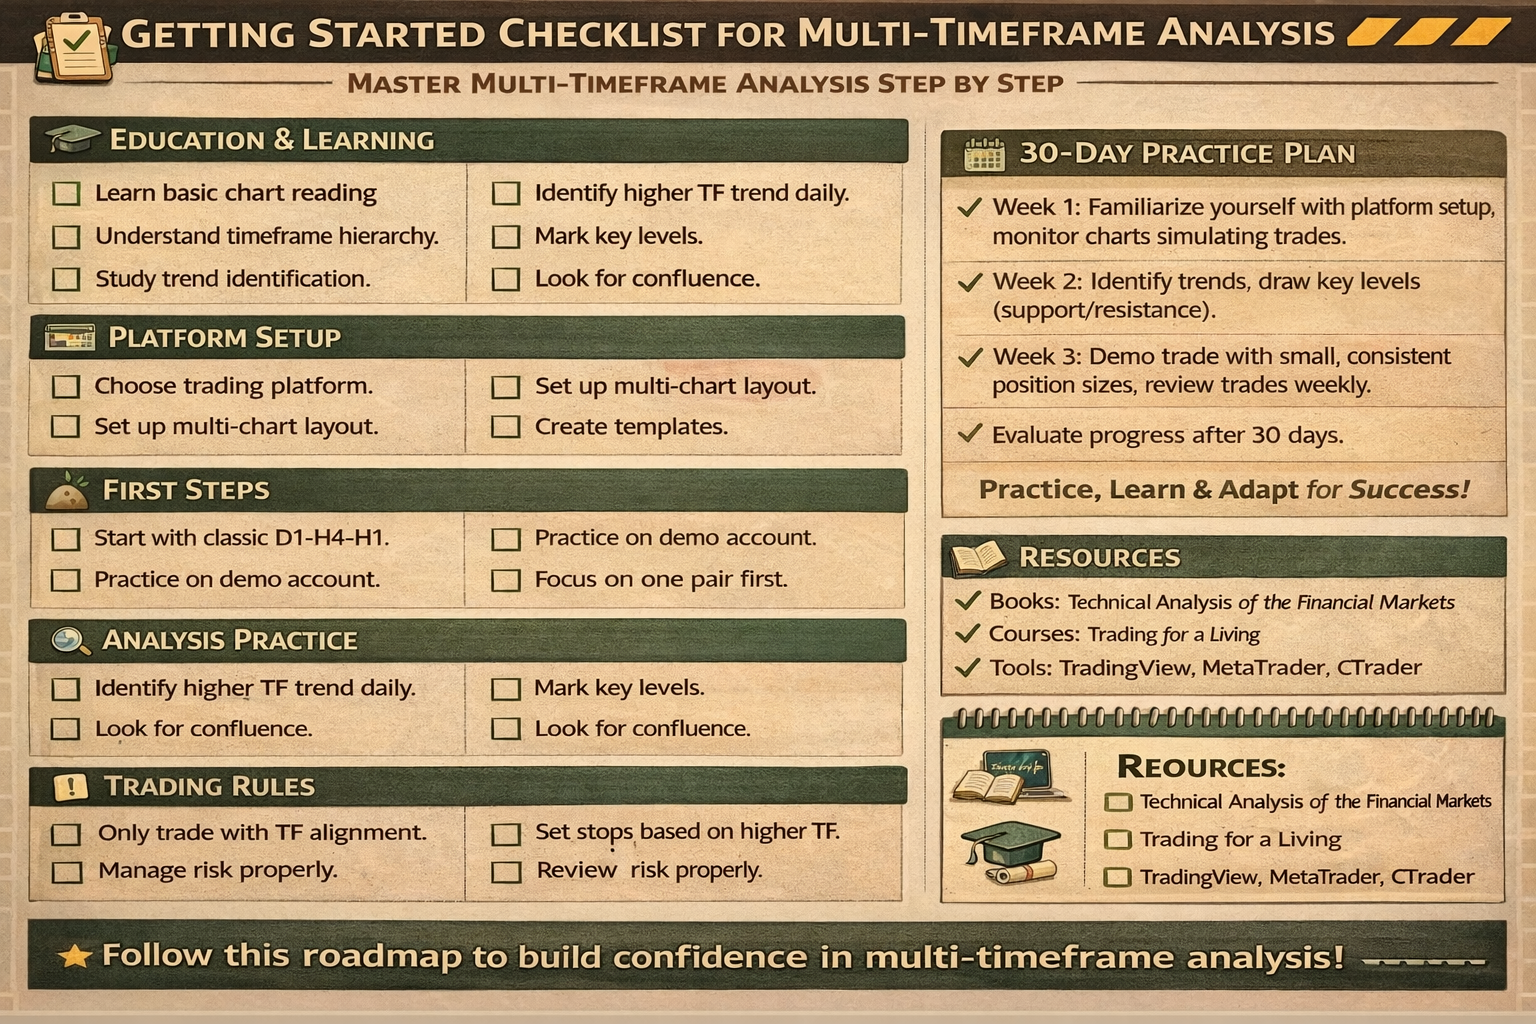
Ready to implement multi-timeframe analysis in your trading? Follow this step-by-step plan:
Quick Start: Your First Multi-Timeframe Trade
- 1Open daily chart → Is it trending? If yes, which direction? Mark major support/resistance.
- 2Switch to 4-hour → Is price pulling back to support (uptrend) or resistance (downtrend)?
- 3Check 1-hour → Wait for reversal candlestick pattern at the pullback level.
- 4Drop to 15-minute → Enter on break of 15min high/low in trend direction.
- 5Place stop below 1-hour structure, target at daily resistance/support level.
Learn More
Explore related trading strategies to complement your multi-timeframe analysis:
Try Our Robots
Our AI robots use multi-timeframe analysis automatically:
Related Articles
Frequently Asked Questions
What is multi-timeframe analysis in forex trading?
Multi-timeframe analysis is a trading method where you analyze the same currency pair across different timeframes (daily, 4-hour, 1-hour, etc.) to identify trend direction, key support/resistance levels, and optimal entry points. This provides a complete market picture and improves trading decisions by giving you context from multiple perspectives.
Which timeframes should I use for multi-timeframe analysis?
The most effective combination is using three timeframes: Higher timeframe (daily/4H) for trend direction, Medium timeframe (1H/30min) for trade setup, and Lower timeframe (15min/5min) for precise entry. Day traders typically use 1H/15min/5min, while swing traders use Daily/4H/1H. The key is maintaining at least 4-6 times difference between timeframes.
How does multi-timeframe analysis improve trading accuracy?
Multi-timeframe analysis improves accuracy by providing context and confirmation. You avoid fighting the larger trend, identify stronger support/resistance levels seen on multiple timeframes, and find high-probability entry points where multiple timeframes align (confluence). Studies show this can increase win rates by 30-40% compared to single-timeframe trading.
Can beginners use multi-timeframe analysis effectively?
Yes! Multi-timeframe analysis is excellent for beginners because it prevents common mistakes like trading against the trend. Start with just 2-3 timeframes, keep your analysis simple, and focus on aligning your trades with the higher timeframe trend. This structured approach actually makes trading decisions easier and more systematic.
Put This Knowledge Into Action
Explore SignalWavesAI tools and start applying what you've learned with professional forex signals.